KYCIS TECHNICAL BLOG
Category: GC
Browse all articles in this category.
-
How to Turn Chromperfect ZED Files into Reviewable Liquid GC Reports
Chromatography software can produce an accepted liquid-GC result, but that result is often only the start of a PVT lab deliverable. Before it reaches an engineer or external client, the lab may still need to normalize the composition, apply the agreed internal-standard assumptions, check component names, combine liquid and gas results, and present the outcome…
-
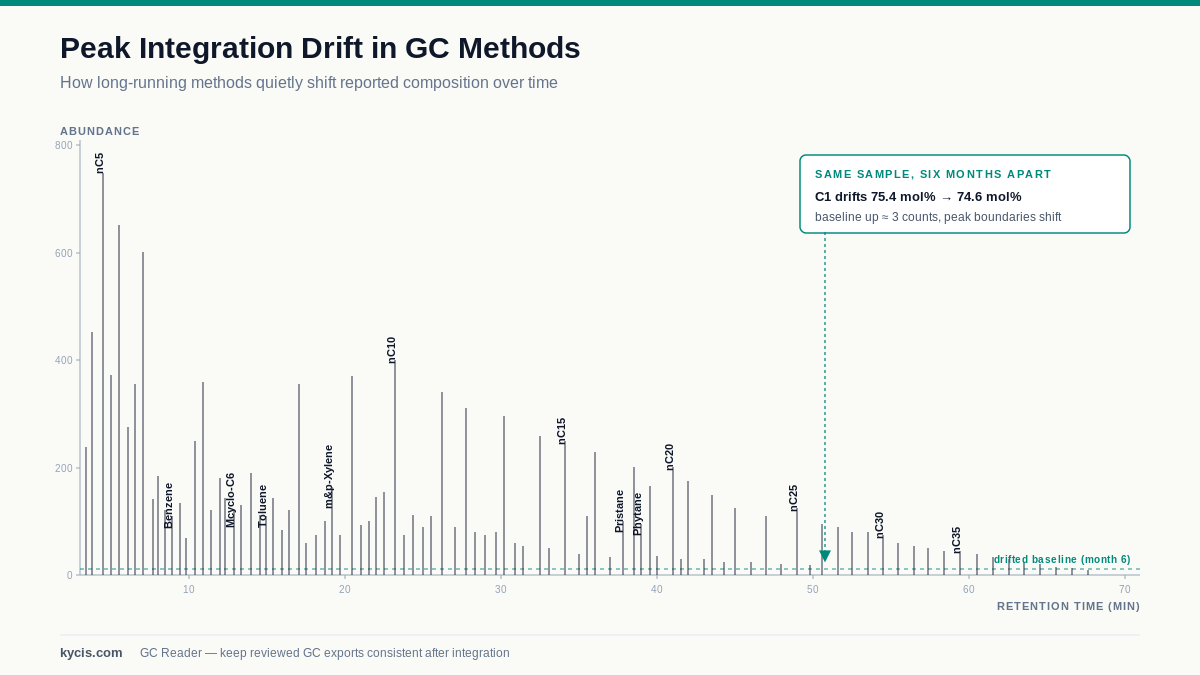
Peak Integration Drift: Why Composition Results Keep Changing
Peak integration drift is one of the quieter ways GC composition results move over time. The chromatogram may still look acceptable, and the method may still export a valid CSV, but small changes in baseline treatment, integration thresholds, retention windows, or manual review habits can alter reported peak areas enough to affect final composition values.…
-
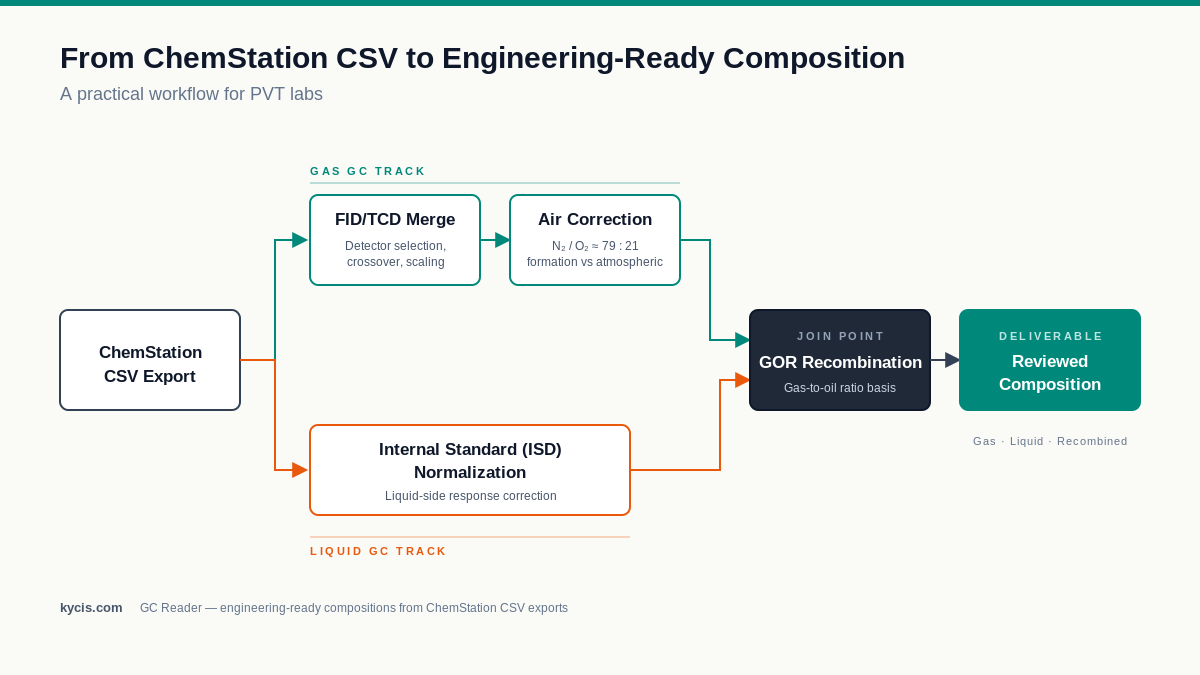
From ChemStation CSV to Engineering-Ready Composition: A Practical Workflow for PVT Labs
A ChemStation CSV export is a starting point, not a finished engineering composition. It may contain detector output, component names, peak areas, sample identifiers, report-template headers, and method-specific formatting. But by itself, it is not yet a composition that can be handed to a PVT report, EOS model, reservoir engineer, or client without review. The…
-
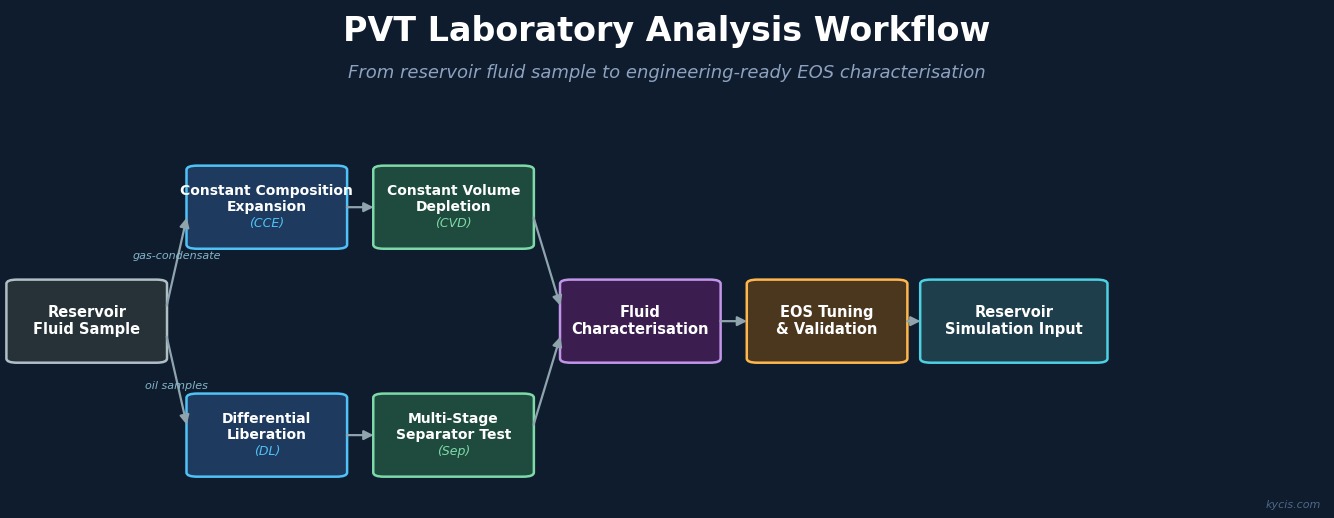
The PVT Lab GC Workflow: From Wellsite Sample to Engineering Software
A complete map of the PVT lab GC workflow — from wellsite sampling through ChemStation processing to engineering software — with the decision points that determine data quality at each stage.
-
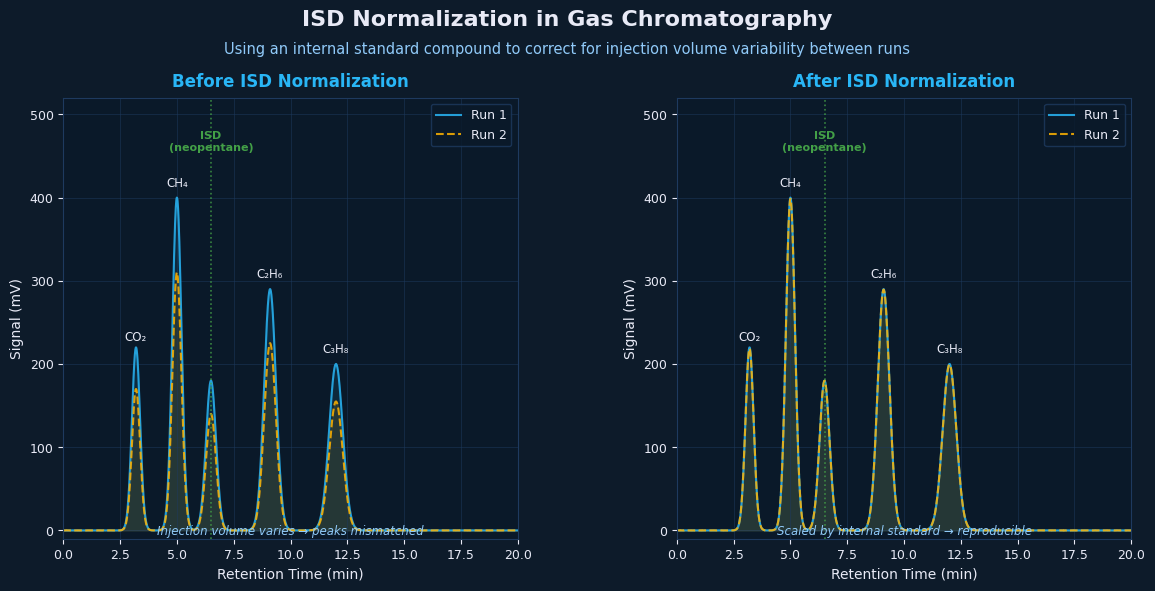
ISD Normalization in Gas Chromatography: What It Is and Why It Matters
Internal standard normalization corrects for injection volume variation and instrument drift before you calculate mole fractions. Here’s how it works and what goes wrong when it’s applied incorrectly.
-
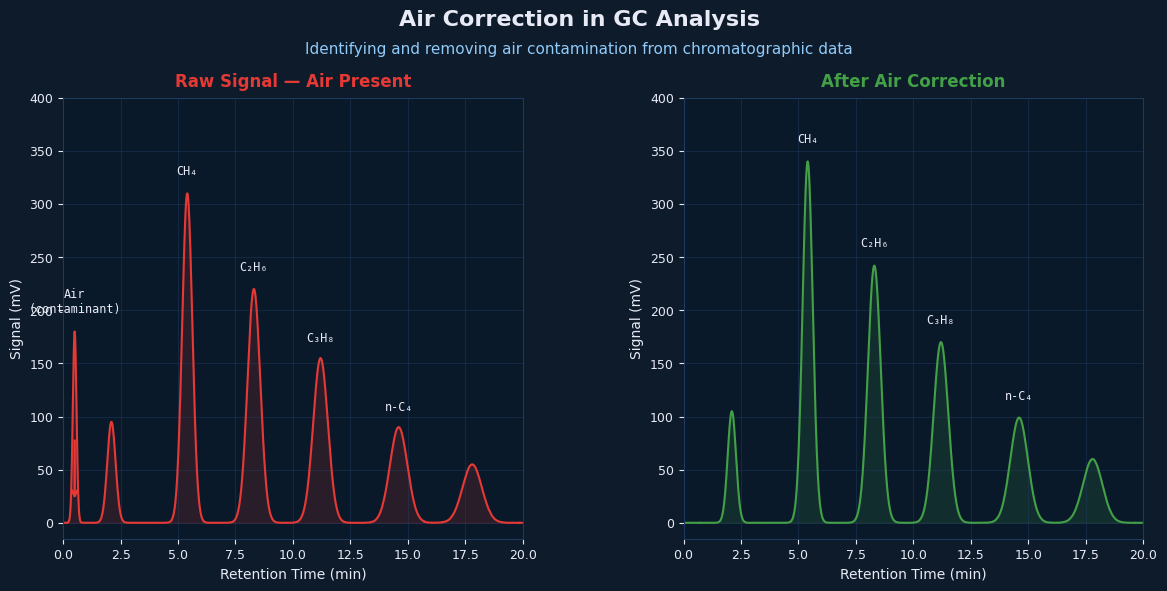
Air Correction in GC Analysis: How to Handle Atmospheric Contamination in Reservoir Fluid Compositions
Air contamination in GC samples inflates nitrogen readings and distorts every normalized component. Here’s how to identify it, calculate the correction, and apply it correctly.
-
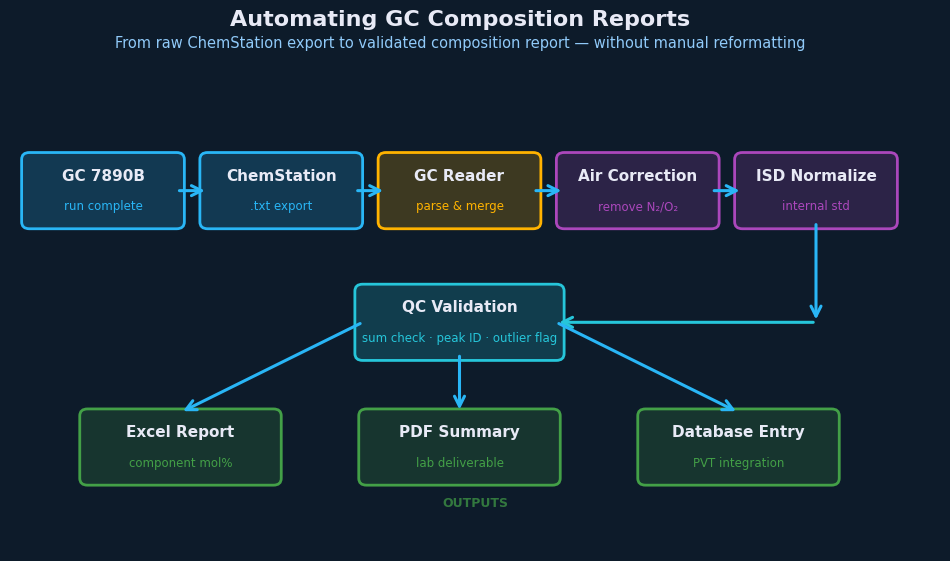
Automating GC Composition Reports: From ChemStation to Engineering Software
Most PVT labs still process GC data manually in Excel. Here’s what full automation looks like — from raw ChemStation CSV to engineering-ready compositions — and what it takes to get there.
-
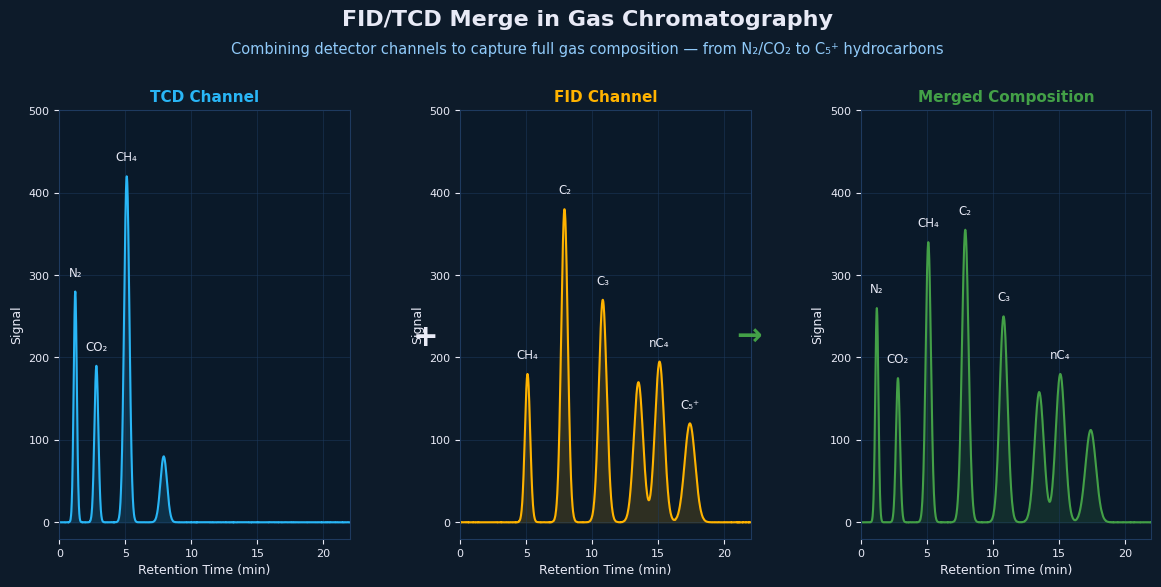
FID/TCD Merge in Gas Chromatography: Why Your Composition Numbers Are Wrong
Dual-detector GC systems run FID and TCD on the same sample — but combining their results correctly requires more than just copy-pasting columns. Here’s what the merge actually involves.
-
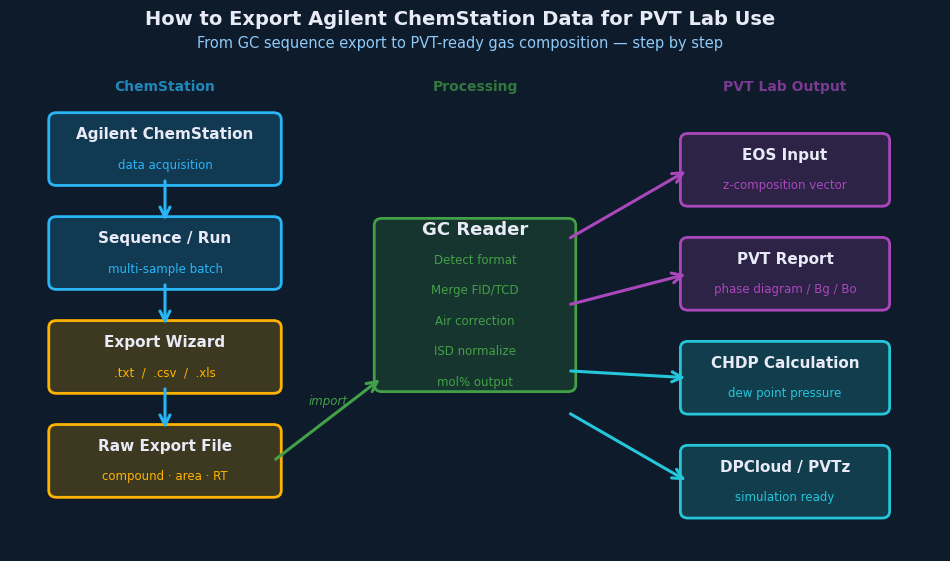
How to Export Agilent ChemStation Data for PVT Lab Use
Step-by-step guide to exporting Agilent ChemStation data as CSV for PVT analysis. Covers report templates, common export errors, and how to prepare GC output for engineering workflows.