If you run gas chromatography samples in a PVT lab, you’ve almost certainly spent time wrestling with Agilent ChemStation’s export system. The data is all there — peak areas, response factors, component names — but getting it out of ChemStation and into a format your engineering tools can actually read is its own workflow, with its own failure modes.
This guide walks through the complete export process, covers the most common issues, and explains what the resulting CSV actually contains.
Why ChemStation Export Matters for PVT Work
ChemStation is designed for analytical chemistry workflows. PVT labs use it to quantify the composition of reservoir fluid samples — gas compositions, liquid compositions, recombined wellstream fluids. But ChemStation’s native output is a printed report or a proprietary .D data file, neither of which is directly usable by reservoir simulation software, PVT packages like PhazeComp or WinProp, or in-house spreadsheet tools.
The CSV export bridges that gap. Done correctly, it gives you a structured table of component names, mole fractions (or normalized areas), and calibration-corrected quantities that downstream software can consume without manual transcription.
What You Need Before Exporting
Before running an export, confirm: a report method is configured (ChemStation calculates compositions based on the calibration and quantitation method embedded in the sequence method — without it, your CSV will contain raw peak areas rather than calculated concentrations); the calibration is current (stale response factors produce incorrect mole fractions regardless of how clean the export is); and column assignment is correct for FID and TCD (on dual-detector systems, both signal channels need to be mapped to their respective component lists before export).
Step-by-Step: Exporting a ChemStation Sequence to CSV
| Step | Action in ChemStation | Output |
|---|---|---|
| 1 | Open completed sequence in Data Analysis | Sequence loaded with all runs visible |
| 2 | Select File → Export → Export Data | Export dialog opens |
| 3 | Choose “Results Table” format, select CSV | Format options configured |
| 4 | Select all samples in sequence, check “Include headers” | All runs selected for export |
| 5 | Set output path, click Export | CSV file created with peak areas, retention times, and quantitation results |
| 6 | Verify CSV in Excel — check component names match method | Ready for GC Reader import |
1. Open the Sequence or Data File
In the ChemStation Data Analysis module, open the sequence you want to export via File → Load Sequence. If you’re working with a single run, open the .D directory directly.
2. Set the Report Template
Navigate to Report → Specify Report. For PVT export purposes, the most useful template types are External Standard (uses a calibration curve to convert peak area to absolute concentration — best for quantitative PVT compositions) and Area% (reports each component as a percentage of total peak area with no calibration — useful when absolute response factors aren’t available).
If your lab has a custom report template already configured, use it — the key requirement is that “Save as Text File” or “CSV” output is enabled in the template settings.
3. Enable CSV File Output
In the report template editor, go to the Destination tab: check “File” as an output destination, set the file type to CSV (comma-separated) or TXT (tab-separated), set a consistent output directory, and confirm “Append to file” is unchecked if you want one file per run.
4. Run or Re-Process the Report
If the sequence has already been analyzed, you can re-run the report without reintegrating the chromatogram: use Sequence → Process Sequence and select “Report only” if integration is already finalized. For a single sample, use Report → Print Report (this will also write to file if the template is configured correctly).
5. Verify the Output File
Open the CSV in a text editor — not Excel — to check the raw structure before doing anything else. A clean ChemStation CSV contains a header row, then rows for each component with sample name, run date, compound name, retention time, area, calculated amount, and units. If you see garbled compound names, missing columns, or only raw areas with no amounts, the report template or calibration has an issue to fix before going further.
Common Export Problems
CSV contains only peak areas, no calculated amounts. The report template is not linked to a calibration method, or the calibration file is missing or outdated. Open Calibration → Load Calibration Table and verify it points to a valid .cal file before re-running the report.
Component names don’t match your PVT software’s component library. ChemStation uses whatever names are in the calibration table. If your lab uses abbreviations (“nC4” vs “N-BUTANE”), you’ll need to either update the calibration table names or handle the mapping in post-processing. This is one of the most common sources of manual work in lab-to-engineering data handoffs.
The CSV has two separate tables — one for FID, one for TCD. This is expected on dual-detector systems. ChemStation reports each detector’s results separately. Merging them into a single normalized composition requires a separate step. See our article on FID/TCD merge for the complete procedure.
Mole fractions don’t sum to 100%. Usually caused by unresolved peaks, a component missing from the calibration table, or an air peak that wasn’t properly assigned. Check the integration report for unidentified peaks.
What the CSV Contains (and What It Doesn’t)
A standard ChemStation CSV export contains: sample name and run metadata (date, method file, operator), component names and retention times, peak areas and peak heights, calculated amounts (concentrations or mole fractions) if calibration is applied, and detector assignment for dual-detector systems.
It does not contain the actual chromatogram signal (that stays in the .D file), uncertainty or signal-to-noise information, detector response factor tables (those live in the calibration file), or any normalization that accounts for the full wellstream (gas + liquid recombination requires a separate step).
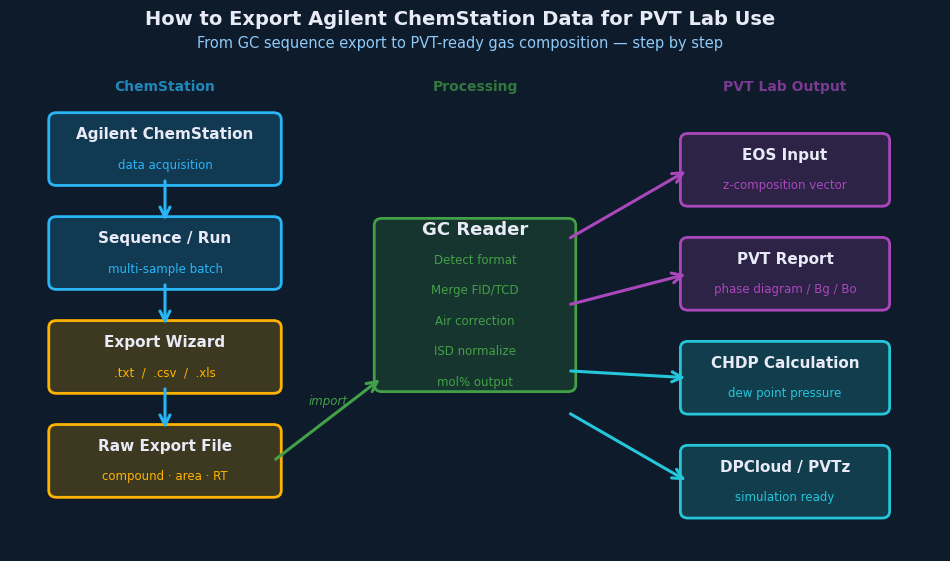
Preparing the CSV for Engineering Use
Once you have a clean CSV, the remaining steps for PVT analysis are: merge FID and TCD results into a single normalized composition, apply air correction to remove atmospheric nitrogen and oxygen contamination, normalize to 100 mol% with the C₇₊ fraction properly lumped, and format for your target PVT package — each simulator has its own component naming and input format conventions.
Doing these steps manually in Excel takes 20–45 minutes per sample and introduces transcription errors. GC Reader automates the full sequence — from raw ChemStation CSV through merged, corrected, normalized compositions — in seconds.
Downstream calculation note: once the composition has been merged, corrected, and normalized, it can be used in reservoir-fluid packages, EOS models, dew-point calculations, or other engineering tools. That downstream step is separate from the lab data-processing problem: the immediate goal is a defensible composition table that does not depend on repeated manual reformatting.
Next in this series: FID/TCD Merge in Gas Chromatography: Why Your Composition Numbers Are Wrong →