If you work in a PVT lab, you probably have a spreadsheet. Maybe several. One for the FID/TCD merge. One for air correction. One that converts the merged composition into the format your reservoir simulator expects. Possibly a master workbook that ties them together, last edited by someone who left the company two years ago.
This is the standard operating procedure at most PVT labs — not because the work is complex, but because the tools that handle the front end (ChemStation) and the back end (PVT simulators, reservoir models) have never talked to each other. The spreadsheet is the bridge.
This article covers what automating that bridge actually looks like: what steps can be automated, where the decisions lie, and what you need to build or buy to get there.
The Manual Process, Step by Step
To understand what automation replaces, it helps to map the full manual workflow. For a single GC sample processed in a typical PVT lab:
1. Run the sample on the GC (instrument time: 15–45 min depending on column)
2. Review the chromatogram — check peak integration, look for co-elutions or baseline issues (5–15 min)
3. Export from ChemStation — configure the report template, run the export, retrieve the CSV (5–10 min)
4. Open the CSV in Excel — check column structure, rename headers to match your template (5 min)
5. Separate FID and TCD tables — ChemStation exports them together or separately depending on your configuration (5 min)
6. Apply cross-calibration scaling — scale one detector to the other using a reference component (5–15 min)
7. Merge into a single composition — assign each component to the appropriate detector (10–20 min)
8. Apply air correction — identify and subtract atmospheric contamination from the nitrogen peak (5–15 min)
9. Apply ISD normalization — if an internal standard was used, correct peak areas before calculating mole fractions (5–15 min)
10. Normalize to 100 mol% — re-normalize the combined composition (2–5 min)
11. Format for target application — reformat component names and order for PVT software, reservoir simulator, or client report (10–30 min)
12. QA check — verify totals, compare against expected ranges, flag outliers (5–15 min)
For a single clean sample with no integration issues: 60–120 minutes of analyst time. For a batch of 10 samples: a full day.
What Can Be Automated
The good news: steps 3 through 11 are entirely deterministic given a defined procedure. They require no analyst judgment — only correctly applying a consistent set of rules to structured input data. That makes them automatable.
The CSV Parsing Layer
A robust automation reads ChemStation CSV files in their native format without requiring manual reformatting. This means handling variable column orders (ChemStation template configuration affects output structure), multiple tables in a single file (FID and TCD sections separated by blank rows or headers), encoding issues (ChemStation sometimes outputs non-UTF-8 characters in component names), and batch files (multiple samples concatenated into one export).
Getting this layer right is most of the engineering work. ChemStation’s CSV format has enough variation between labs and configurations that a tool built for one lab’s output often breaks on another’s.
The FID/TCD Merge Logic
The dual-detector setup works because the TCD is a non-destructive detector — it doesn’t consume the sample during measurement. The column effluent passes through TCD first, and the same gas stream then continues to the FID. Both detectors are measuring the same injection; ChemStation records each detector’s output as a separate table. The merge step combines them into one.
Once the tables are parsed, the merge itself is a defined calculation: identify the crossover component (configurable per lab procedure), apply the cross-calibration factor, assign each component to its source detector, and combine into a single table. The only variable is the crossover decision, which is a lab-specific configuration parameter — not something that changes sample to sample.
Air Correction
If air contamination is detected (presence of both N₂ and O₂ peaks), subtract the atmospheric contribution using the known N₂:O₂ ratio (78.09:20.95). This is a one-line calculation once the peaks are identified.
ISD Normalization
If an internal standard was injected, the raw peak areas need to be corrected before the mole fraction calculation. The correction factor is derived from the measured vs. expected ISD peak area — again, a deterministic calculation once the ISD component is identified.
Output Formatting
The final step — reformatting for different target applications — is also automatable if the target formats are known in advance. Common outputs include normalized mol% tables for PVT simulators (PhazeComp, WinProp, CMG), separator test recombination input format, and client-facing lab report tables.
Where Human Judgment Still Matters
Before: Reviewing the chromatogram for integration quality. A correctly automated pipeline processing a badly integrated chromatogram will give you a precise answer to the wrong question. The automation only applies after the analyst has confirmed the GC run is valid.
After: Interpreting results. If the merged composition produces a dewpoint 30°C higher than the previous sample from the same well, that might be a measurement anomaly or it might be a real fluid change. Either way, it requires an engineer’s eyes.
The automation doesn’t eliminate the analyst — it eliminates the part of the job where the analyst is acting as a human spreadsheet.
Build vs. Buy
For labs that process more than 5–10 samples per week, the automation is worth building or buying.
Building in-house: Doable with Python and a few days of development time — if you have someone who can write and maintain the code, understands the GC processing logic deeply, and can handle the edge cases that appear in real lab data. The ongoing maintenance cost is the main downside.
Building in Excel with VBA: Many labs have done this. It works until it doesn’t — usually when a new ChemStation version changes the export format, or when the macro fails silently on an unusual sample and no one notices until the PVT report is wrong.
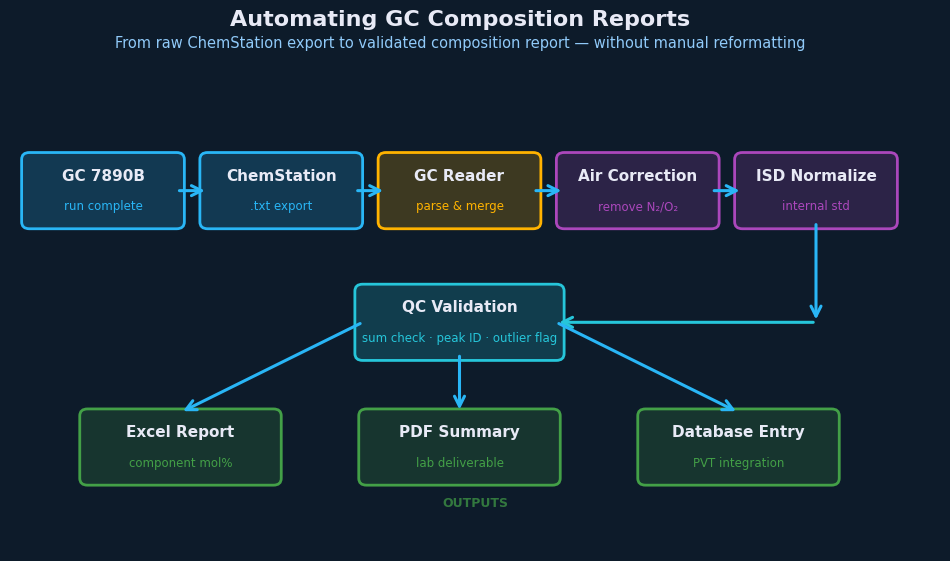
Purpose-built software: GC Reader handles the full sequence — ChemStation CSV parsing, FID/TCD merge, air correction, ISD normalization, and output formatting — with configuration options that match real PVT lab procedures. It runs on Windows with no external dependencies, and outputs compositions in formats ready for engineering workflows.
The Practical Impact
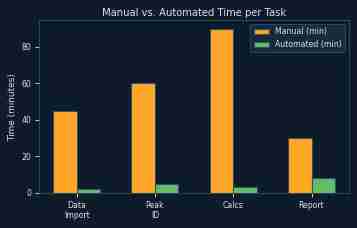
For a lab processing 50 samples per month, automating steps 3–11 recovers roughly 2–4 hours of analyst time per day. That’s time that was previously spent reformatting data — not analyzing it.
The quality improvement is harder to quantify but arguably more important. Manual transcription errors in composition data propagate into every calculation that uses them: fluid characterization, phase envelope construction, material balance, well deliverability. Eliminating the manual steps eliminates that error vector.
GC Reader workflow
Turn repeat GC report work into a controlled workflow.
GC Reader is built for recurring PVT lab workflows where ChemStation CSV exports need to move through FID/TCD detector merge, air correction, component alias review, ISD normalization, and report-ready composition output without fragile copy-paste spreadsheets.
Continue reading: