Dew point is an onset line, not a liquid-volume answer
Hydrocarbon dew point is often treated as the central number in natural-gas phase behavior. That is reasonable, but incomplete. A dew-point temperature tells an operator when the first hydrocarbon liquid starts to form at a stated pressure. It does not tell the operator how much liquid forms after the gas crosses that boundary.
That difference matters in pipeline operations. A regulator outlet, a meter run, a compressor suction header, and a low-flow lateral can all cross the hydrocarbon dew-point boundary. The operational consequence depends on whether the system is seeing trace onset, a small liquid yield that can be swept through, or enough NGL dropout to affect measurement, equipment protection, or a contractual liquid-content limit.
This is where quality line dew point analysis (also known as liquid yield contour analysis) becomes useful. A dew-point line answers, does liquid begin? A quality line answers, how much liquid has formed? DPCloud calculates both from the same Peng-Robinson phase-behavior basis, so teams can move from a simple onset alarm toward a liquid-yield operating envelope.
The distinction is especially important for rich gas, winter cold spots, pressure reduction, and gas-quality decisions where the consequence is not merely the existence of liquid, but the amount of liquid expected under a specific operating condition.
What a quality line means on the phase envelope
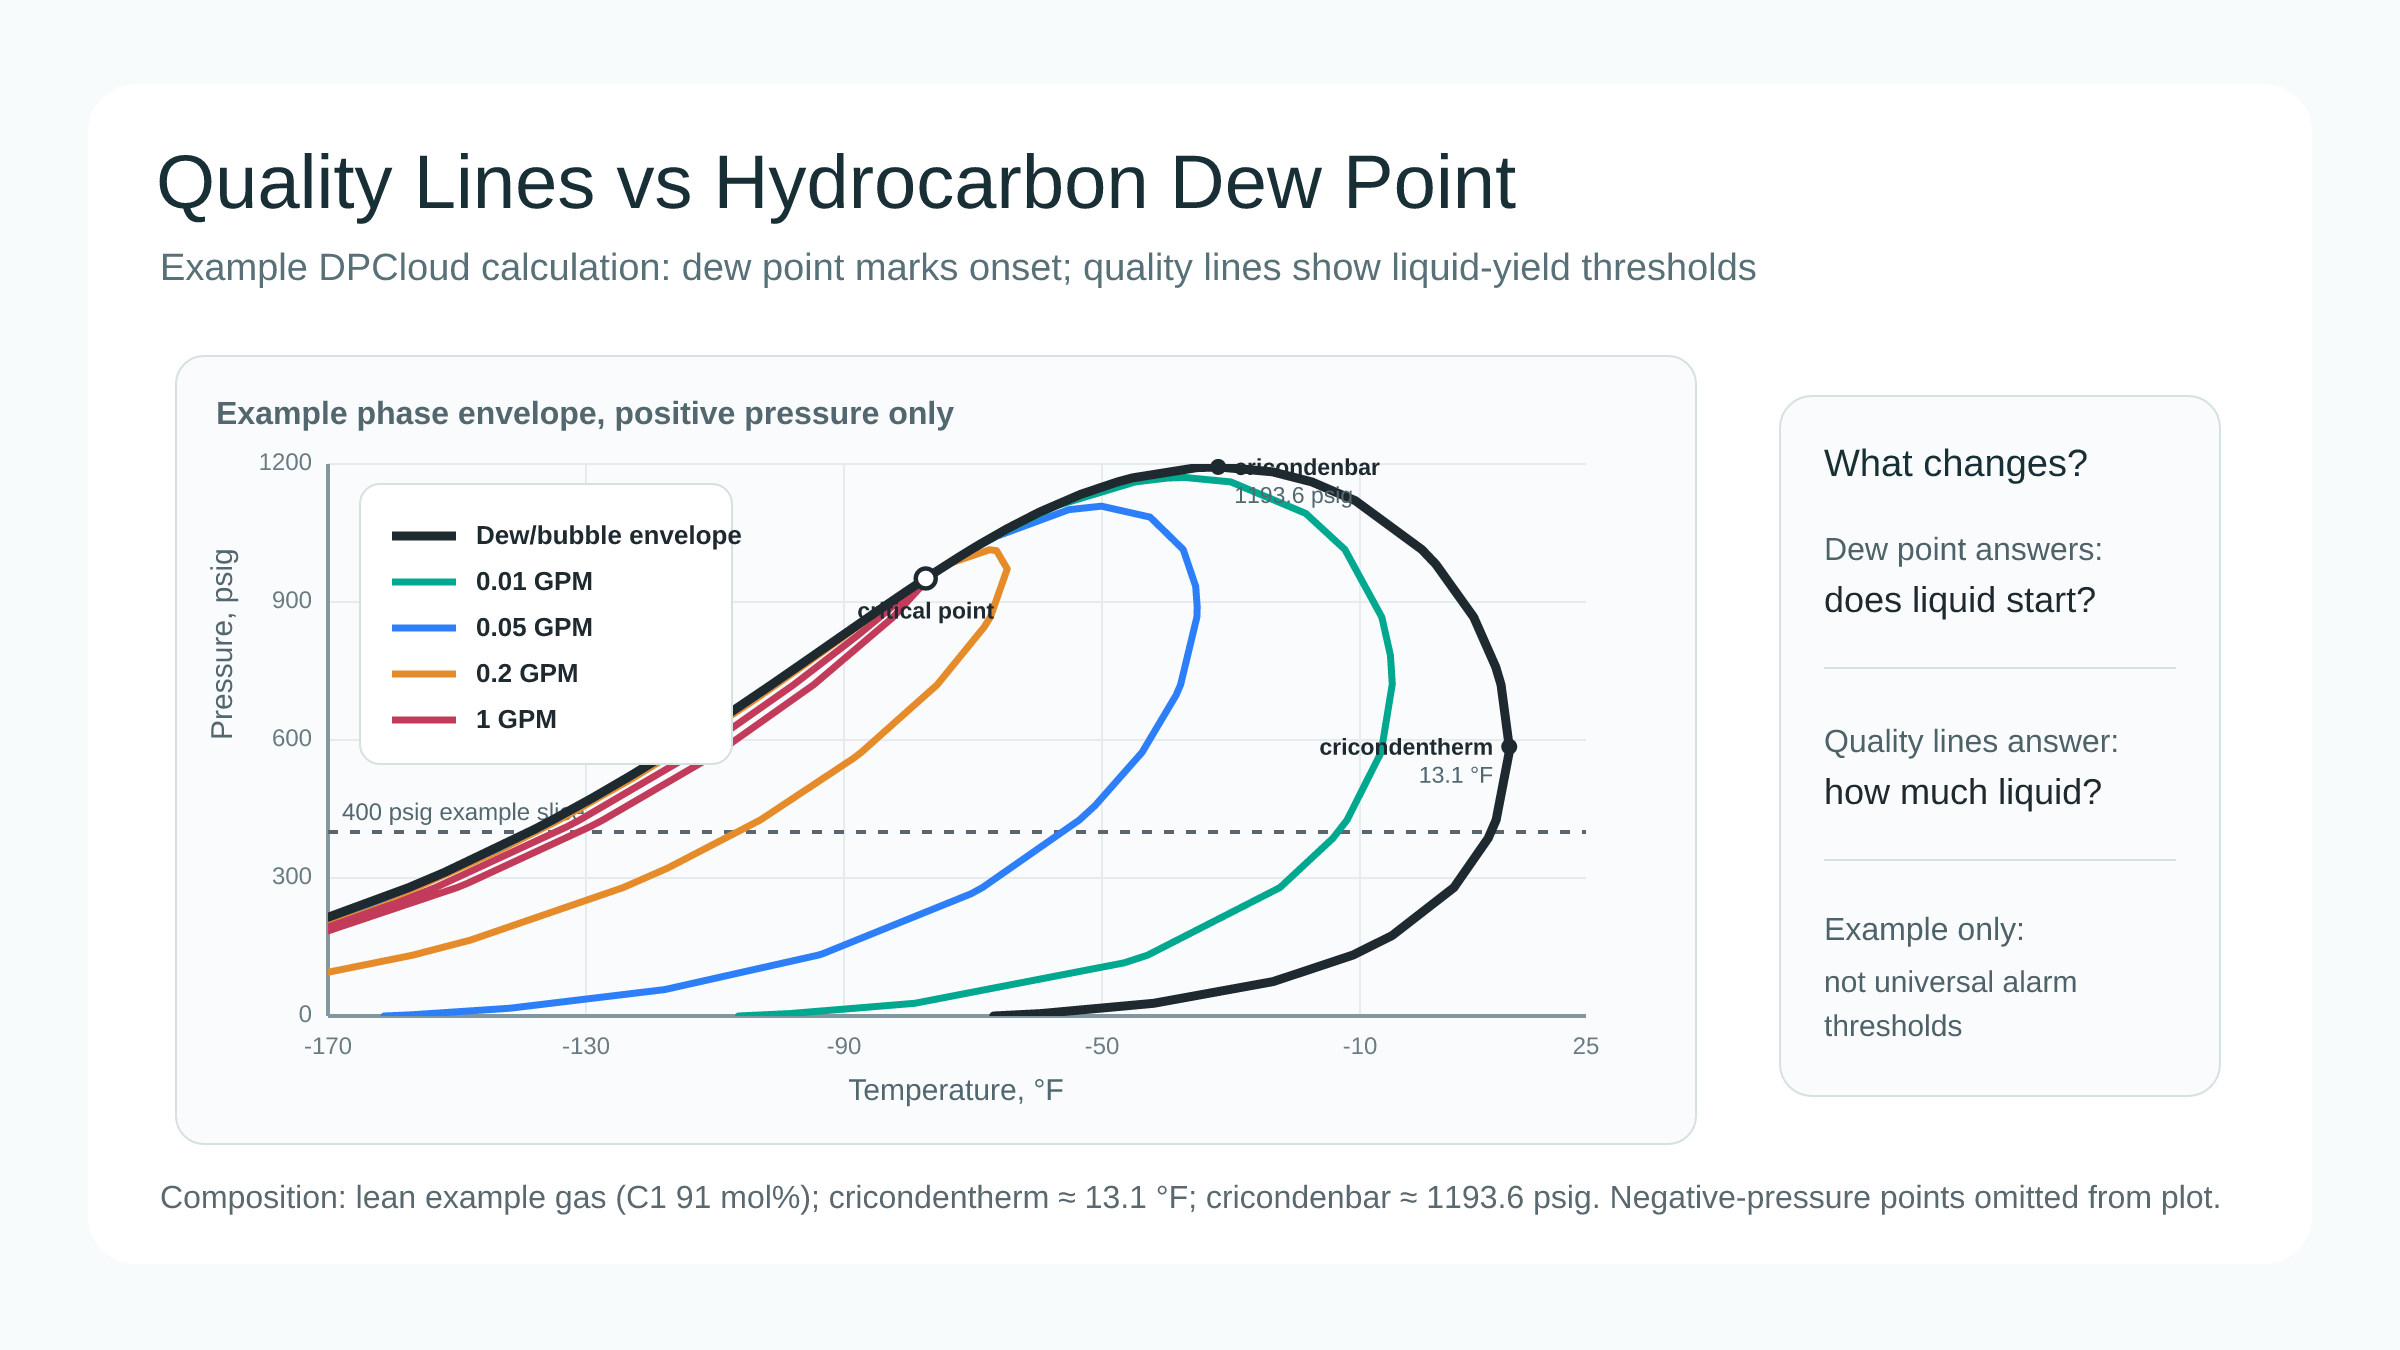
On a pressure-temperature phase envelope, the dew-point curve is the boundary where a vapor-phase gas first enters the two-phase region. Inside that region, additional cooling or pressure change can increase the liquid fraction. A quality line is a contour inside the envelope that corresponds to a specified liquid yield or liquid fraction.
For DPCloud, the public-facing explanation can stay simple: the user supplies a target liquid-yield basis, such as a GPM value (gallons of recoverable liquid per Mcf of gas), and the calculation returns the pressure-temperature contour where the gas reaches that target. The exact threshold belongs to the customer operating basis. The concept is the important part: quality lines turn the phase envelope from a picture of liquid onset into a map of liquid consequence.
The figures in this article use a DPCloud-generated example, not customer data. The example gas is lean: methane is 91 mol%, with smaller amounts of ethane, propane, butanes, pentanes, hexane, nitrogen, and carbon dioxide. DPCloud calculated the phase envelope (including its cricondentherm and cricondenbar) and quality lines at 0.01, 0.05, 0.2, and 1 GPM. The values are included to explain geometry and operating interpretation, not to define universal alarm limits.
Because this example gas is lean, the quality-line contours sit well inside the dew-point boundary. That is useful pedagogically. It shows that first liquid onset can occur long before the gas reaches a larger liquid-yield threshold. For this gas, the 1 GPM contour also sits near the theoretical maximum liquid yield the composition can produce, which is why it appears as a narrow loop in the chart rather than a broad band. A richer gas, a different heavy-end split, or a different pressure range could place those contours much closer together. The figure should therefore be read as an example of method and geometry, not as a general rule about how far apart dew point and quality lines will be.
Why quality lines matter operationally
Quality lines matter because pipeline decisions are often consequence decisions. Operators do not only ask whether hydrocarbon liquid can form. They ask whether the expected liquid yield can affect a meter, compressor, station low point, regulator outlet, processing objective, or gas-quality commitment.
In rich gas blending, a dew-point alarm may show that a blend is near liquid onset. A quality-line view can show whether the blend is approaching a liquid-yield threshold that the operator has decided is operationally important. In compressor suction service, first liquid onset and meaningful carryover are not identical questions. In meter runs, single-phase measurement requirements make liquid presence important, but the amount, location, and persistence of the liquid affect the operational response.
Quality lines also connect directly to winter cold-spot work. The KYCIS article on cold-spot prediction in winter pipeline operations explains why average temperature is not enough. W13 extends that idea: even after a cold spot is identified, the team still needs to know whether that location is near onset or near a defined liquid-yield contour.
For NGL recovery and gas processing, quality lines can also support economic thinking. A processing plant may care about how liquid yield changes across upstream conditions. A pipeline may care about avoiding liquid dropout. Both questions use phase behavior, but the operating objective is different. The quality line gives the team a way to express that objective as a contour on the same pressure-temperature map.
Dew-point margin alone can be conservative or misleading
A dew-point margin is useful because it is simple. If the flowing temperature is comfortably above the hydrocarbon dew point at the relevant pressure, the gas is single phase on that basis. If the margin is small or negative, operators know the condition deserves attention. That simplicity is why dew-point alarms remain useful.
However, the simplicity also hides two different realities. In one case, the gas may have just crossed the dew-point boundary and only a trace amount of liquid is predicted. In another case, the gas may be deeper in the two-phase region, where liquid yield is materially larger. A plain dew-point alarm can flag both cases as “liquid possible,” even though the operating consequence may be different.
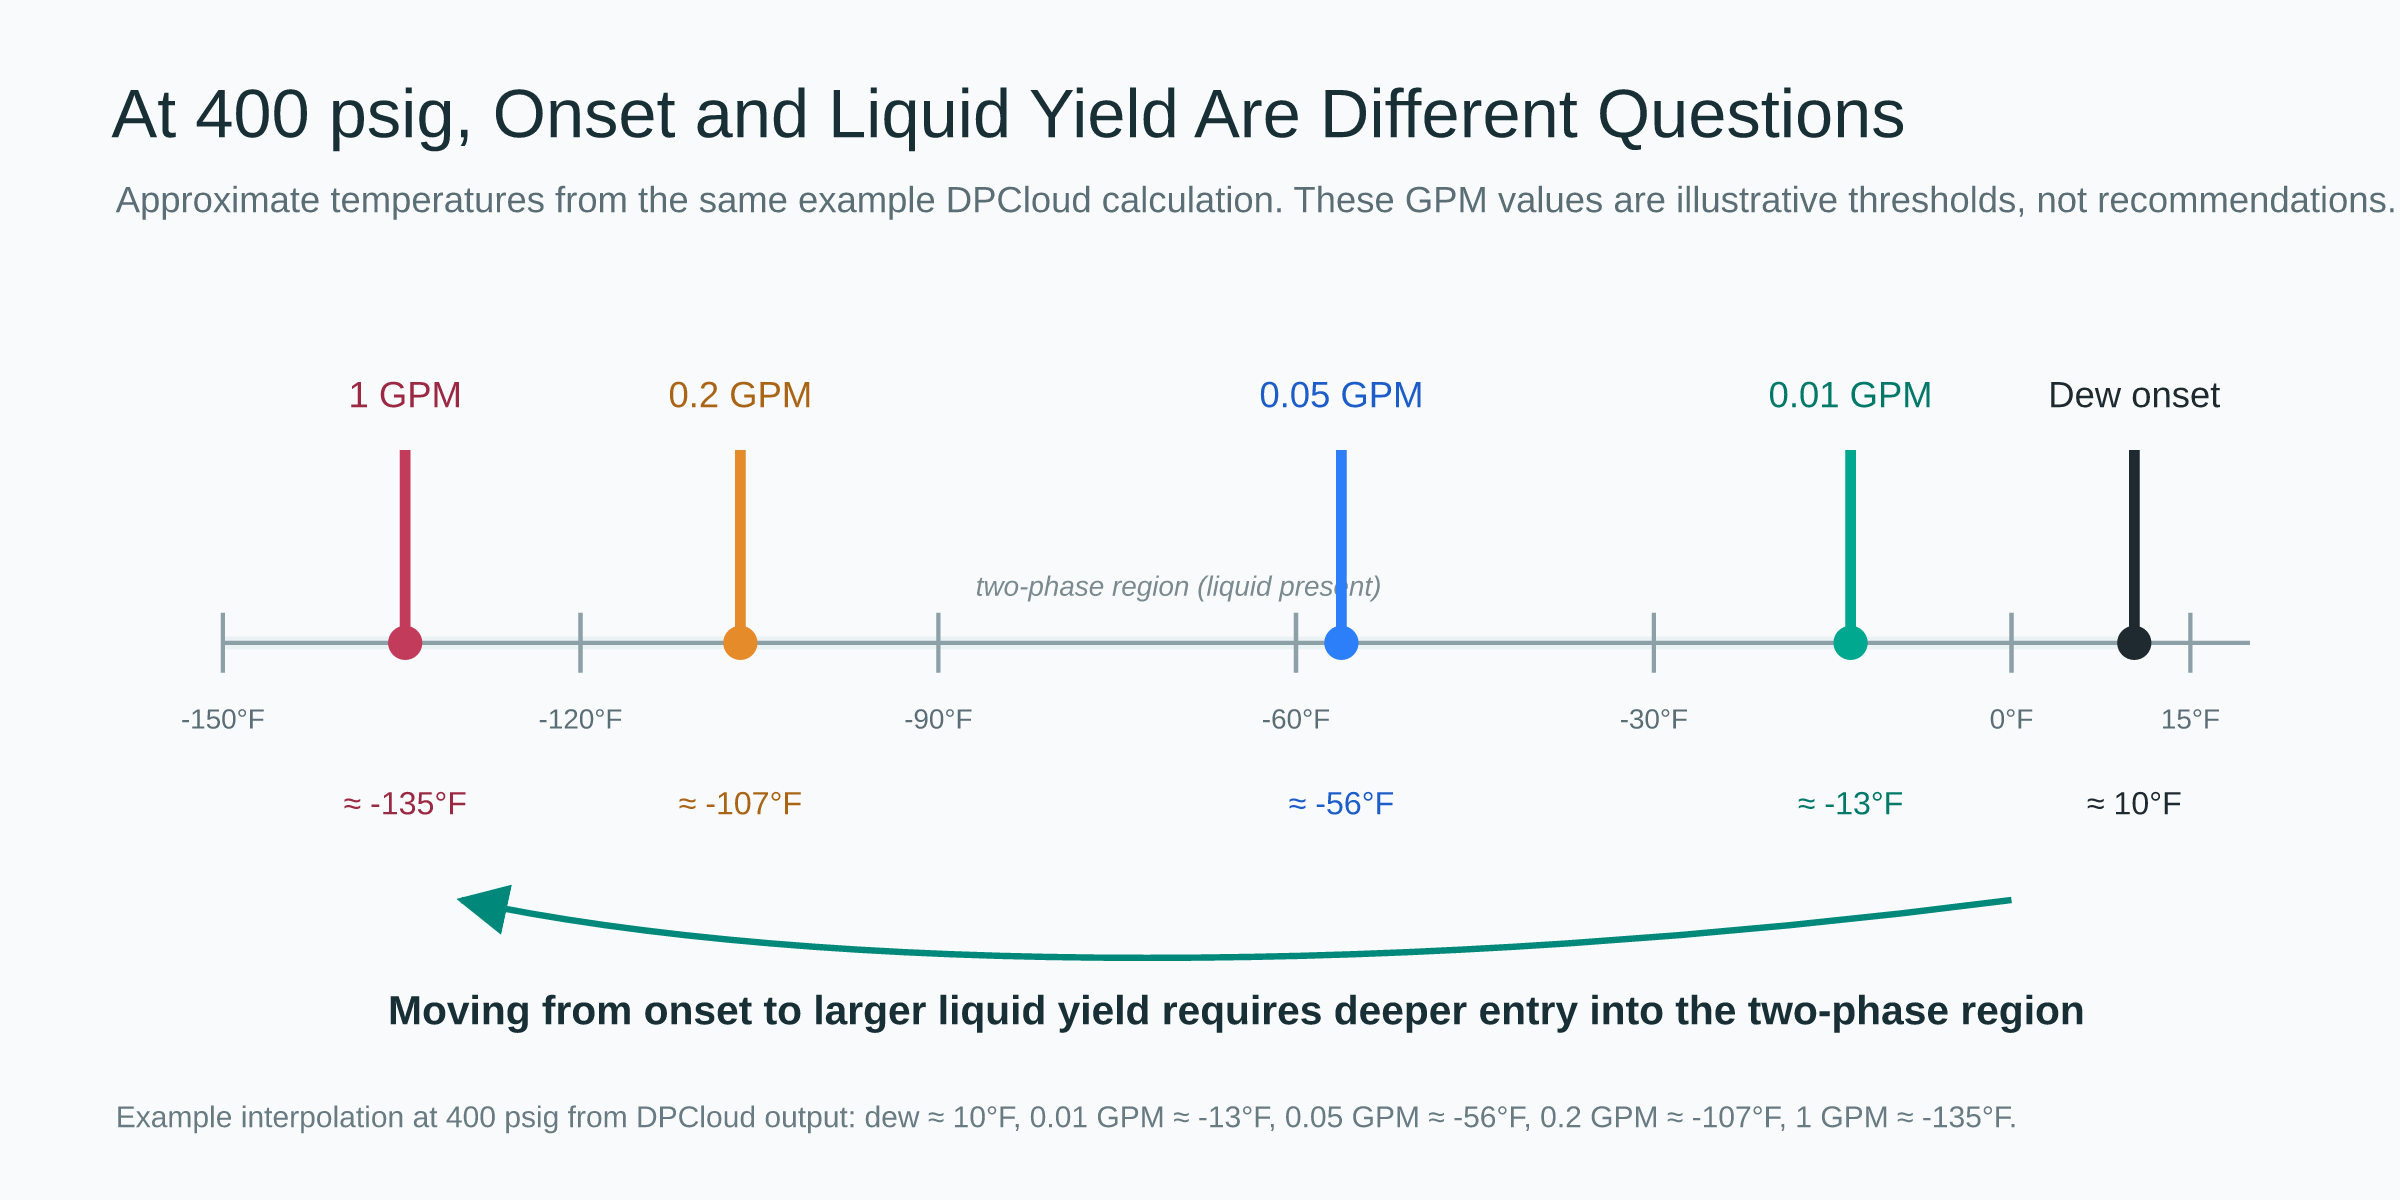
The example calculation makes this visible. At a 400 psig slice through the phase envelope, the hydrocarbon dew-point onset is near 10 deg F. The 0.01 GPM quality line is around -13 deg F, the 0.05 GPM line is around -56 deg F, the 0.2 GPM line is around -107 deg F, and the 1 GPM line is around -135 deg F. Those numbers are not recommended thresholds. They simply show that, for this lean example gas, onset and larger liquid-yield thresholds are very different operating questions.
A richer gas would not necessarily show the same spacing. That is the point. Dew-point margin and liquid-yield behavior depend on composition, pressure, heavy-end characterization, and equation-of-state basis. For more on composition and model basis, see the KYCIS article on Peng-Robinson, SRK, and AGA8 for natural-gas phase-envelope calculation.
How to read a quality-line plot without overreading it
A quality-line plot should be read in layers. The first layer is the dew-point boundary. Outside the boundary, the gas is predicted to remain single phase on the calculation basis. At the boundary, first liquid appears. Inside the boundary, the quality lines show selected liquid-yield contours. The operating point can then be compared against those contours instead of being judged only by whether it is inside or outside the envelope.
The second layer is the pressure basis. A contour does not answer a generic question such as “is this gas safe?” It answers a pressure-specific and composition-specific question. At one pressure, the operating temperature may sit between the dew-point line and a low-GPM quality line. At another pressure, the same temperature may lie closer to a higher-yield contour. This is why a quality-line alarm needs the same care as a dew-point alarm: pressure, temperature, and composition must all refer to the operating point being evaluated.
The third layer is consequence. In the example figure, 0.01 GPM, 0.05 GPM, 0.2 GPM, and 1 GPM are plotted as illustrative thresholds. A real operating workflow would not choose those values because they look tidy on a chart. It would choose thresholds because they correspond to a contract, equipment concern, measurement requirement, processing objective, or internal engineering screen. Without that consequence layer, quality lines are only curves. With it, they become operating context.
Quality-line alarms and plain dew-point alarms answer different questions
A plain dew-point alarm is still valuable. It is easy to understand, easy to trend, and useful for early warning. A quality-line alarm adds another layer when the operating team has a liquid-yield threshold that better reflects the consequence they are trying to manage.
| Dimension | Dew-point alarm | Quality-line alarm | Phase envelope with quality lines |
|---|---|---|---|
| Primary question | Has liquid started to form? | Are we near a defined liquid-yield threshold? | Where is the operating point relative to onset and liquid-yield contours? |
| Typical use | Basic phase-behavior warning | Operating limit or consequence screening | Engineering review, blend screening, alarm design |
| Rich-gas sensitivity | Shows onset | Shows yield growth at selected threshold | Shows the broader liquid-yield operating envelope |
| Operator meaning | “Liquid may begin.” | “The selected GPM threshold is near.” | “The current condition sits between these phase-behavior contours.” |
| Best supporting data | Pressure, temperature, composition | Same data plus selected GPM basis | Validated composition, pressure range, quality-line basis, operating objective |
This is not an argument to replace all dew-point alarms. It is an argument to match the alarm to the decision. If the decision is first liquid onset, use dew point. If the decision is liquid-yield consequence, use a quality-line basis. If the decision is operating-envelope design, use the full phase envelope with quality lines.
How DPCloud supports quality-line analysis
DPCloud supports hydrocarbon dew-point, water dew-point, phase-envelope, and quality-line calculations from the same operational calculation service. For quality-line analysis, the important public message is that DPCloud uses the same Peng-Robinson basis as its HCDP and phase-envelope calculations, with customer-configurable composition and BIP basis where appropriate.
That consistency matters. A team should not have one thermodynamic basis for the dew-point tag, another basis for the phase envelope, and a third basis for quality-line screening unless that difference is intentional and documented. A consistent basis makes the output easier to audit, validate, and explain.
DPCloud is not a direct measurement instrument. It is a calculation service. Its value is that the same calculation basis can be used in engineering review, live API workflows, and SCADA-facing operating tags. For how calculation should be compared against measured data, see the KYCIS article on validating DPCloud against lab-measured dew points.
Quality-line analysis also makes input discipline more important, not less. A dew-point calculation is already sensitive to gas composition and heavy-end representation. A quality-line calculation asks a deeper question inside the two-phase region, so the same upstream assumptions can matter even more. If a C6+ split, pseudo-component basis, or BIP set is changed, the quality-line operating envelope may move. That does not make the method unreliable; it means the calculation basis must be controlled and documented.
For live deployment, the practical benefit is consistency. A team can use one basis to calculate HCDP margin, phase envelope, and selected quality-line thresholds. That lets operations, process engineering, and gas-quality teams discuss the same envelope instead of reconciling separate charts produced by separate tools. The result is not just another thermodynamic plot. It is a shared operating map.
For a browser-based view of how phase-envelope calculation appears in an operating interface, see the DPCloud live demo. For product positioning and deployment options, see the DPCloud product page.
Choosing a practical GPM threshold
There is no universal GPM threshold that KYCIS should recommend in a public article. A threshold that is meaningful for one system may be irrelevant or unsafe for another. The correct basis depends on the contract, equipment, operating envelope, and consequence being managed.
Practical sources for a threshold include pipeline tariff or gas-quality language, compressor or rotating-equipment protection requirements, metering single-phase expectations, processing-plant objectives, internal engineering design basis, and historical operating experience. In some cases, the threshold may begin as a conservative engineering screen and later be adjusted after validation and reconciliation with measured behavior.
The threshold should also be tied to location. A small amount of predicted liquid in a high-flow mainline section may have a different consequence than the same predicted yield in a low-flow lateral, an exposed meter run, or a compressor suction pocket. That is why quality-line analysis belongs beside cold-spot screening and not only beside the nominal station outlet condition.
In practice, many teams start conservatively. They may define a watch threshold and an action threshold, then compare those alarms against field experience, lab measurements, and maintenance history. If the watch threshold is too sensitive, operators will ignore it. If the action threshold is too loose, the alarm will arrive after the operating consequence has already appeared. Quality lines do not remove that judgment. They give the team a better phase-behavior basis for making it.
What quality lines do not solve
Quality lines are powerful, but they are not a substitute for every flow-assurance tool. A quality-line calculation does not replace a multiphase hydraulic simulation. It does not prove slugging behavior, liquid holdup, pressure-drop impact, or dynamic transient response. Those questions require hydraulic modeling, field data, and site-specific engineering judgment.
Quality lines also do not replace measurement. They help operators interpret liquid-yield consequence from a thermodynamic calculation basis. They do not turn a calculation into custody-transfer proof. When formal evidence is required, measurement methods, sampling procedures, and contract language still matter.
Finally, quality lines depend on the same inputs that drive hydrocarbon dew point: gas composition, pressure, heavy-end characterization, equation-of-state choice, and BIP assumptions. If those inputs are weak, the quality-line result inherits that weakness. This is why quality-line operating envelopes should be built on a validated calculation basis, not treated as decorative curves.
From dew-point monitoring to liquid-yield operating decisions
Dew-point monitoring tells teams when the gas is approaching first liquid onset. Quality-line analysis adds the next question: how much liquid is expected at this operating condition, and does that amount matter for the decision in front of us?
That is the commercial value of quality lines in DPCloud. They move phase-envelope calculation from a thermodynamic plot toward an operating envelope for liquid-yield decisions. The output can support richer alarm design, blend screening, cold-spot ranking, and engineering review without pretending that one universal GPM threshold fits every pipeline.
If you have target GPM thresholds, rich-gas blend cases, cold-spot limits, or a dew-point-only alarm that needs better liquid-yield context, contact KYCIS. We can help scope a DPCloud quality-line workflow around your composition basis and operating objective.
References
- KYCIS, Cold-Spot Prediction: Why Average Pipeline Temperature Is Not Hydrocarbon Dew-Point Margin.
- KYCIS, Validating DPCloud Against Lab-Measured Dew Points: What Agreement Really Means.
- KYCIS, Dew Point Measurement vs Real-Time Calculation: ISO 18453, Chilled Mirrors, and When to Trust Which.
- KYCIS, What Is Cricondentherm Hydrocarbon Dew Point?.
- KYCIS, Hydrocarbon Dew Point vs Water Dew Point.
- KYCIS, Peng-Robinson vs SRK vs AGA8 for Natural-Gas Phase-Envelope Calculation.