Average temperature is not the winter risk
Winter dew-point management often starts with a simple question: is the pipeline gas warm enough to stay above its hydrocarbon dew point?
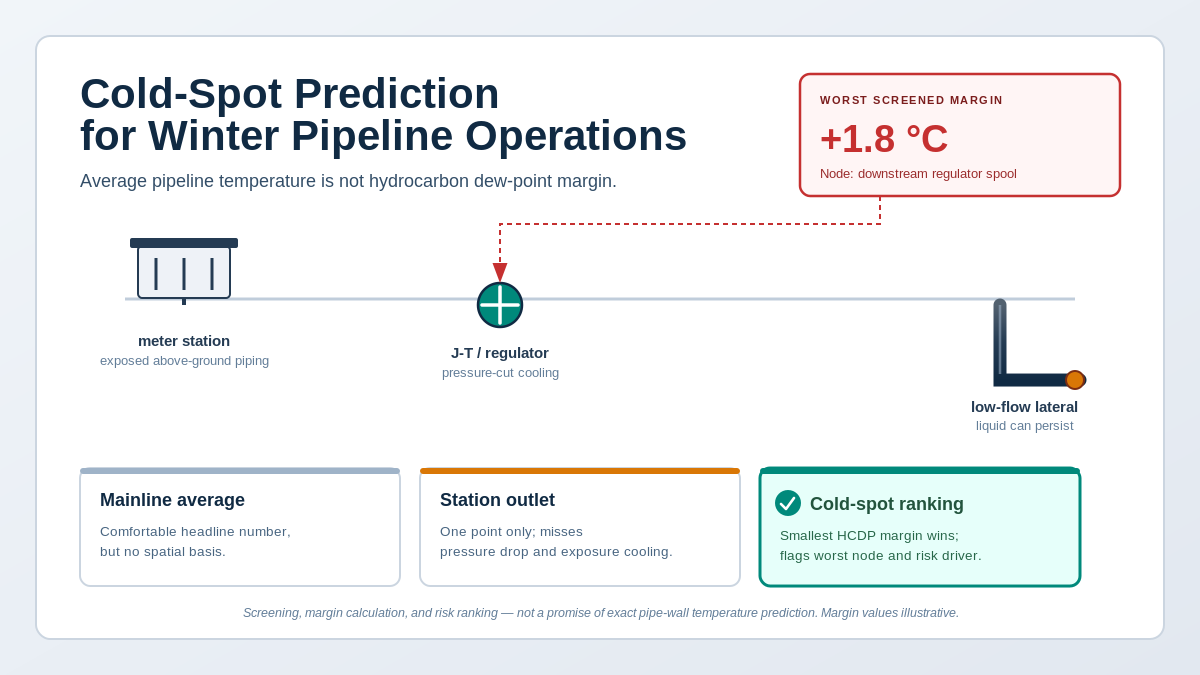
That question is useful, but it is incomplete. The number that matters operationally is not the average pipeline temperature. It is not always the station outlet temperature. It is not necessarily the closest SCADA temperature transmitter. Hydrocarbon liquid dropout begins where the local pressure-temperature condition crosses the hydrocarbon dew-point boundary, and that location is usually the weakest point in the thermal and hydraulic profile.
In winter pipeline operations, the weakest point is often a cold spot: a local section where the gas and pipe wall are colder than the surrounding system, where pressure reduction creates Joule-Thomson cooling, or where low velocity allows condensed liquid to remain instead of being swept downstream. A line can look acceptable from the control room and still have a local section with very little dew-point margin.
This is why real-time hydrocarbon dew-point calculation and cold-spot prediction belong together. The calculation tells you the phase behavior of the gas at the current composition and pressure. Cold-spot screening tells you where that calculation should be applied, which operating locations have the smallest margin, and which alarms deserve operator attention.
Our previous article on dew-point measurement versus real-time calculation focused on trust: when to use certified measurement, when to use live Peng-Robinson calculation, and how uncertainty enters the decision. This article focuses on space. It asks where hydrocarbon condensation risk is likely to appear during winter operations, and how a SCADA-facing calculation service can turn that risk into ranked operating margin.
Hydrocarbon condensation is a local condition
Hydrocarbon dew point is pressure dependent. A gas stream can be safely single phase at one pressure and temperature, then move toward the two-phase region after a pressure drop, cooling event, or composition shift. The full phase envelope is the right mental model: the same gas composition has a dew curve, a cricondentherm, a cricondenbar, and pressure-specific dew-point temperatures.
That is the reason station-average thinking fails. A pipeline does not have one temperature, one pressure, or one heat-transfer environment. It has buried sections, exposed pipe, valve yards, regulator runs, compressor suction and discharge areas, meter stations, aerial crossings, river crossings, dead legs, and low-flow laterals. It also has local restrictions and pressure drops that can cool the gas even when the surrounding ambient condition is unchanged.
The NGC+ / NAESB white paper on hydrocarbon liquid dropout makes this point in practical terms. It identifies ambient air temperature as a factor for above-ground piping, notes that water crossings can affect flowing gas temperature, and warns that piping offsets at crossings can create low points where hydrocarbon liquids collect. It also gives a common operating rule of thumb for pressure reductions at meter or regulation stations: gas temperature can drop about 7 °F for every 100 psi of pressure reduction, up to about 1000 psig. That makes a 600 psi pressure reduction a roughly 42 °F cooling event before local heat transfer is considered. The exact cooling depends on gas composition, inlet pressure, inlet temperature, and expansion path, so the rule should be treated as a screening estimate rather than a design guarantee.
For operators, the implication is direct: a hydrocarbon dew-point margin calculated only at a station outlet does not describe the entire pipeline. It describes one point. Winter risk management needs the worst credible point.
Common winter cold spots
The following locations appear repeatedly in pipeline operations, gas-quality discussions, and flow-assurance literature. They are not KYCIS customer cases. They are generic, public-domain operating patterns that should be screened using site-specific data.
River crossings and low points
Water crossings can create cooler local thermal environments, especially in winter. Even where modern construction uses horizontal directional drilling and deep burial, crossings can include elevation changes, offsets, and low points. If hydrocarbon liquid forms, gravity can collect it in sags where it increases pressure drop, restricts flow, or appears later as intermittent slugging.
Above-ground station piping
Meter stations, gate stations, compressor stations, and valve yards often contain exposed pipe runs, short spool pieces, valves, and instrumentation taps. These sections can cool faster than buried line pipe during night-time or winter ambient swings. If insulation, heat tracing, or enclosure conditions are inconsistent, the coldest metal temperature can be local rather than representative of the station average.
Pressure reduction and Joule-Thomson points
Regulators, control valves, chokes, and J-T valves are obvious cold-spot candidates because pressure reduction can cool the gas rapidly. The risk is strongest when the upstream gas is rich, the inlet condition is near the hydrocarbon phase envelope, the pressure cut is large, or the station has limited heat input. The same physical mechanism is why heated, multi-stage pressure regulation is used in analytical sample systems to avoid condensation during pressure reduction.
Meter runs
Custody and allocation measurement depend on single-phase flow. A local pressure drop, upstream disturbance, or cold exposed meter tube can create a measurement risk even when the mainline appears acceptable. Hydrocarbon liquid upstream of an orifice plate, ultrasonic meter, or other metering element can distort the measurement basis and trigger maintenance or proving problems.
Low-flow laterals and dead legs
Low velocity changes the consequence of a small amount of liquid. In a high-flow section, a small liquid fraction may be swept through. In a low-flow lateral, idle station branch, or dead leg, the same liquid may collect and persist. Public flow-assurance studies on undulating wet gas pipelines show that liquid loading can form in low-lying areas because of water vapor and condensate precipitation, and that critical liquid-carrying velocity depends on inclination, water content, and pipe diameter.
Compressor suction and station pockets
Compressor suction piping can be exposed, complex, and sensitive to liquid carryover. Liquid dropout upstream of compression is more than a gas-quality issue; it can become an equipment protection issue. Winter cold-spot screening should therefore include suction headers, scrubber approaches, bypass lines, and known low-drain locations.
The point is not that every one of these locations is always dangerous. The point is that each one can have a different local margin than the value shown by the nearest SCADA temperature.
HCDP is the main risk, but not the only one
This article is intentionally focused on hydrocarbon condensation. HCDP is the primary phase-behavior risk when heavy hydrocarbons can drop out of natural gas and form a separate liquid phase.
Water dew point and hydrate risk remain important, but they should not blur the HCDP decision. Water condensation, hydrate formation, and hydrocarbon liquid dropout are different physical problems. They use different inputs, different correlations or models, and different operating responses. A water dew-point analyzer does not prove hydrocarbon dew-point safety, and a hydrocarbon dew-point calculation does not prove hydrate safety.
For a fuller explanation of that distinction, see the KYCIS guide to cricondentherm hydrocarbon dew point and how it differs from water dew point. For W3, the practical rule is simpler: keep the HCDP margin visible as its own tag, and show WDP or hydrate margin as parallel risk channels when the operating workflow needs them.
Why real-time calculation alone is not enough
Real-time dew-point calculation solves a cadence problem. It lets the control system recalculate hydrocarbon dew point and phase-envelope margin whenever the GC composition, pressure, or operating condition changes. That is the foundation. It is not the whole winter workflow.
If the calculation is only attached to one nominal operating point, the output can still be misleading. A tag called HCDP_Margin_C is useful only if the pressure and temperature basis behind it is clear. Is it the margin at the station outlet? At the meter run? Downstream of the regulator? At the coldest exposed pipe segment? At a modeled river crossing low point? Those are not interchangeable values.
Cold-spot screening adds that missing spatial basis. It does not need to claim perfect pipe-wall temperature prediction. In many operational deployments, a conservative screening model is more useful than a falsely precise thermal model. The screen can rank candidate locations using measured temperatures where available, estimated exposure factors where direct measurements are absent, pressure-drop calculations at known restrictions, ambient correction, flow state, and asset knowledge from operations and integrity teams.
The result should be a ranked list of margin, not a single magic number:
- Worst hydrocarbon dew-point margin across monitored or screened locations.
- Location or node responsible for the worst margin.
- Driver of the risk, such as pressure drop, exposed pipe, low flow, or composition shift.
- Confidence level, based on whether the temperature is measured, inferred, or manually configured.
- Recommended operator context, such as check heat tracing, verify regulator heating, inspect known low point, or confirm GC composition.
That is enough to change the control-room conversation from “the pipeline temperature is above dew point” to “Node 14 has the smallest hydrocarbon margin because the regulator cut and ambient exposure are both unfavorable.”
A SCADA-facing cold-spot workflow
The useful workflow is deliberately simple:
- Read the current gas composition from the GC or validated composition source.
- Read operating pressure, local temperature, flow state, and station status from SCADA.
- Apply phase-envelope and HCDP calculation to each candidate cold-spot node.
- Apply conservative local temperature or pressure-drop adjustments where the node is not directly measured.
- Rank all candidate nodes by hydrocarbon dew-point margin.
- Write the worst margin, worst node, driver, and alarm state back to the historian.
In practice, those outputs can be normal SCADA or historian tags:
| Tag | Meaning |
|---|---|
HCDP_Margin_C | Current hydrocarbon dew-point margin at the selected node |
HCDP_WorstNode | Candidate location with the smallest hydrocarbon margin |
HCDP_RiskRank | Ordered risk class or numeric score for operator display |
HCDP_RiskDriver | Dominant cause: cold exposure, pressure drop, low flow, composition |
HCDP_AlarmState | Normal, watch, alarm, or latched alarm state |
WDP_Margin_C | Optional parallel water dew-point margin |
Hydrate_Margin_C | Optional parallel hydrate margin where modeled |
This is where integration matters. A calculation that lives in a spreadsheet or offline engineering tool cannot drive an alarm banner. A calculation that writes back to the historian on the same cadence as the GC can. For implementation patterns, see the earlier KYCIS article on integrating real-time dew point calculations into SCADA.
Inline figure – cold-spot risk ranking workflow
Latency and model choice still matter
Cold-spot ranking can multiply the number of calculations. A single station may have several candidate nodes: inlet, outlet, regulator downstream, meter run, exposed above-ground spool, bypass, and nearby line low point. A larger system can have many more. If each candidate node requires a fresh phase-envelope or hydrocarbon dew-point call, calculation latency becomes part of the architecture.
This is where DPCloud’s latency work matters. The earlier article on sub-150 ms dew-point calculations explained why a real-time calculation service has to keep both average and tail latency under control. Cold-spot screening uses the same requirement. The calculation needs to keep up with the GC and SCADA update cycle, not arrive after the operating condition has already changed.
Model choice matters as well. Peng-Robinson and SRK are the normal cubic EOS families for hydrocarbon phase-envelope work; AGA8 is primarily a gas-property and compressibility framework, not a phase-envelope model for liquid dropout decisions. The KYCIS article on Peng-Robinson, SRK, and AGA8 for natural-gas calculations gives the background. For cold-spot ranking, the important point is consistency: the same composition basis, pressure basis, heavy-end characterization, and EOS assumptions should be used across all candidate nodes.
What operators should do with the ranking
A cold-spot ranking is not a replacement for operator judgment. It is a way to point judgment at the right part of the system.
When the worst margin tightens, the operating response depends on the driver. A pressure-reduction driver may lead the operator to check regulator heating, stage pressure reduction differently, or verify that a heater is online. An exposed-piping driver may trigger inspection of heat tracing, enclosure temperature, or insulation condition. A low-flow driver may lead to a flow-rate check, lateral scheduling decision, or pigging discussion. A composition driver may trigger GC validation, a shipper notification, or a review of upstream processing.
The ranking also helps integrity and measurement teams speak the same language. Integrity cares about liquid accumulation, corrosion exposure, and slugging risk. Measurement cares about single-phase meter operation and sample representativeness. Gas control cares about alarms, operating limits, and whether the current nominations can be moved safely. A single dew-point value at a nominal station point does not connect those teams. A ranked list of cold-spot margin and drivers does.
Operator action by dominant driver
| Dominant driver | Typical operator action |
|---|---|
| Pressure reduction / J-T cooling | Check regulator heating, confirm pressure-cut staging, verify downstream temperature trend |
| Exposed above-ground piping | Check heat tracing, enclosure temperature, insulation condition, and night-time ambient exposure |
| Low-flow lateral or dead leg | Review current flow state, linepack condition, liquid carryover history, and pigging or drainage options |
| River crossing or low point | Watch pressure-drop trend, liquid accumulation indicators, and known low-drain locations |
| Composition shift | Validate GC basis, review heavy-end trend, and compare against recent measured or lab data |
That is the practical value of keeping the claim modest. DPCloud does not need to promise perfect pipe-wall temperature prediction to be operationally useful. A conservative risk-ranking workflow that exposes the weakest credible hydrocarbon margin is already a major improvement over average-temperature thinking.
The winter operating question
The winter question is not simply “is the pipeline above dew point?”
It is:
Where is the smallest hydrocarbon dew-point margin in the system right now, and what is driving it?
Answering that question requires three layers working together. The first is a reliable gas composition basis from the GC or validated gas analysis. The second is real-time phase-envelope and hydrocarbon dew-point calculation fast enough to follow operating updates. The third is cold-spot screening that applies the calculation to the parts of the pipeline where winter condensation risk is actually likely to appear.
Three layers working together
When those layers are connected, dew-point monitoring stops being a single value on a dashboard. It becomes an operating margin map: which location is closest to hydrocarbon liquid dropout, why it is close, how confident the system is in that ranking, and what the operator should look at first.
That is the role of cold-spot prediction in DPCloud Engineering. Not a black-box promise that every metal temperature is known. A practical screening and risk-ranking layer that turns real-time hydrocarbon dew-point calculation into winter operating decisions.
Try this on your own composition
The most useful way to evaluate cold-spot screening is to start with a gas composition you already understand, then ask how the hydrocarbon dew-point margin changes across pressure, temperature, and exposure assumptions. Use the DPCloud demo to explore phase-envelope behavior, then decide which cold-spot nodes would matter in your own winter operating workflow.
References for Fact Checking
- NGC+ Liquid Hydrocarbon Dropout Task Group / NAESB, White Paper on Liquid Hydrocarbon Dropout in Natural Gas Infrastructure, October 15, 2004. The paper discusses hydrocarbon liquid dropout control, water crossings, ambient temperature, low points, and pressure reduction cooling at meter or regulation stations. Access the NAESB PDF.
- Chen, J. et al., “Calculation model for critical liquid-carrying gas velocity of undulating wet gas pipelines,” You-qi chuyun, 2022. The abstract describes liquid loading in low-lying areas due to water vapor and condensate precipitation in undulating terrain. Access the DOAJ record.
- A+ Corporation / Genie, Joule-Thomson Heated Regulator Model JTR-H Product Brief. The product brief discusses pressure reduction, Joule-Thomson cooling, and condensation prevention for natural gas with high hydrocarbon or moisture dew point. Access the product brief PDF.
- PRCI project PR-663-19600-Z01, Develop Guidance for Calculation of HCDP in Natural Gas Pipelines. PRCI frames HCDP compliance as demonstrated through in-situ testing or EOS-based predictive models. Access the PRCI project page.
- KYCIS, “Dew Point Measurement vs Real-Time Calculation: ISO 18453, Chilled Mirrors, and When to Trust Which.” Read the W2 article.
- KYCIS, “Sub-150 ms Dew Point Calculations: How DPCloud Combines Speed With Numerical Robustness.” Read the W1 article.