The practical question is not “measurement or calculation”
Pipeline gas-quality teams usually do not ask about dew point in the abstract. They ask a more practical question: which number should we trust for this decision?
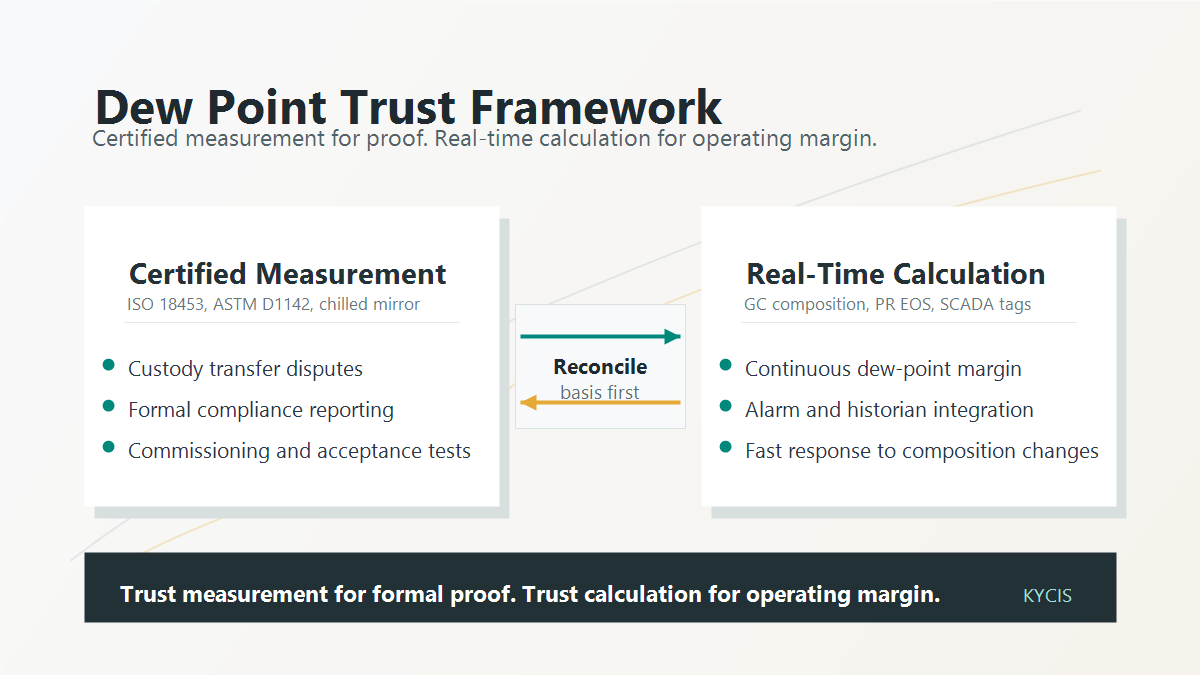
If the decision is a custody-transfer dispute, a contractual compliance report, or a formal acceptance test, the answer usually belongs to a certified measurement. A traceable chilled-mirror measurement, a recognized laboratory report, or an accredited third-party inspection result carries evidentiary weight that a live calculation does not.
If the decision is whether an operator should react to a shrinking dew-point margin right now, the answer usually belongs to real-time calculation. A lab result from yesterday cannot see a composition change that arrived in the latest gas chromatograph cycle. A monthly or weekly test cannot tell the SCADA system that the current operating point is moving toward a hydrocarbon dew point boundary.
That is the distinction this article makes. Measurement and calculation answer different engineering questions. The mistake is treating either one as universally superior.
Our previous article on sub-150 ms dew-point calculation latency explained how DPCloud keeps Peng-Robinson dew-point and phase-envelope calls fast enough for operational use. This article is about the other half of the decision: accuracy, authority, uncertainty, and when a calculated value should be trusted relative to a measured one.
Water dew point and hydrocarbon dew point are not the same problem
Before comparing measurement and calculation, it is important to separate two quantities that are often discussed together but are physically different.
Water dew point is the temperature, at a stated pressure, at which water starts to condense from the gas phase. It is tied to water content, dehydration performance, hydrate risk, corrosion control, and pipeline water specifications. Standards such as ISO 18453 and ASTM D1142 live primarily in this world.
Hydrocarbon dew point is the temperature, at a stated pressure, at which hydrocarbon liquid starts to form from the natural-gas mixture. It is tied to heavy-end composition, C6+ characterization, gas processing, liquid dropout, heating value stability, and custody-transfer hydrocarbon quality. Hydrocarbon dew point is a different phase-behavior problem, not just “water dew point with another fluid.”
This distinction matters because ISO 18453 does not define hydrocarbon dew point. ISO 18453 provides a GERG-developed correlation between water content and water dew point in natural gas. The official ISO abstract also makes a crucial limitation explicit: it “gives the uncertainty for the correlation but makes no attempt to quantify the measurement uncertainties.” In other words, ISO 18453 is a standardized conversion method for water content and water dew point. It is not a blanket accuracy guarantee for every field dew-point reading.
For hydrocarbon dew point, operators more often compare two families of methods: direct or semi-direct chilled-mirror liquid detection, and equation-of-state calculation from gas composition, commonly using Peng-Robinson for natural-gas phase-envelope work. Calibration guidance exists for chilled-mirror hydrocarbon-dew-point instruments, including ISO/TR 12148, but the operating reality is still different from a water-content correlation standard.
The decision rule is similar for both water and hydrocarbon dew point: certified measurement is strongest when the question is formal proof; real-time calculation is strongest when the question is continuous operating margin.
What ISO 18453 actually tells you
ISO 18453 is useful because it gives engineers a standardized way to convert between water content and water dew point for natural gases within its validated range. That matters in pipeline work because contracts and operating limits are not always written in the same units. One party may specify water content. Another may monitor water dew point. A shared correlation gives both sides a common conversion basis.
The important boundary is that ISO 18453’s uncertainty is the uncertainty of the correlation, not the total uncertainty of a field measurement. A correlation can be accurate while the measurement feeding it is not. If the water-content measurement is biased, the sample is not representative, the pressure basis is wrong, or the instrument has drifted, the correlation cannot repair that upstream error.
For a custody-transfer or compliance workflow, this distinction is not academic. A certificate should identify the method, pressure basis, calibration status, sample handling, and uncertainty statement. Saying “ISO 18453 was used” is not the same as saying “the entire measurement system is accurate to a fixed number under field conditions.”
The same logic applies to hydrocarbon dew point. A chilled mirror may be traceable and highly accurate under controlled conditions, but the reported number still depends on whether the gas sample reaching the mirror represents the pipeline gas at the stated pressure and time. A Peng-Robinson calculation may be internally consistent, but its result still depends on the gas composition, heavy-end characterization, binary interaction assumptions, and the operating pressure supplied to the calculation.
The correct engineering question is therefore not “which method is accurate?” It is: which uncertainty dominates in this decision?
Typical uncertainty is layered, not a single number
Engineers often want one accuracy number, such as “±0.2 °C” or “±1 °C.” That number can be useful, but only if the boundary around it is clear. Dew-point uncertainty is layered.
| Component | Typical uncertainty (best case) | Dominant real-world uncertainty sources |
|---|---|---|
| ISO 18453 correlation | About ±0.5 to ±2 °C water dew point, depending on pressure and range | Correlation only; does not include sampling or instrument uncertainty |
| Lab / certified chilled mirror | Often ±0.1 to ±0.2 °C under controlled calibration conditions | Traceability is strong, but the sample and method still matter |
| Field / online chilled mirror | Often wider than the laboratory instrument specification | Mirror contamination, sample conditioning, pressure control, operator judgment |
| Real-time EOS calculation | Often about 0.5 to 3+ °C in practical HCDP work, depending on gas and data quality | GC composition, C6+ characterization, pressure basis, EOS assumptions |
This is why an honest comparison does not say “measurement is always more accurate” or “calculation is always more accurate.” It asks where the largest uncertainty enters.
Where each uncertainty layer dominates
The numbers in the table are not universal guarantees. They are order-of-magnitude engineering ranges that should be tied back to the method, pressure range, gas composition, calibration certificate, and data pipeline in each project. For a well-maintained laboratory chilled mirror with traceable calibration, instrument uncertainty may be small relative to sampling and method conditions. For an online field analyzer with mirror contamination or poor sample transport, the installed-system uncertainty may dominate the instrument specification. For a real-time calculation, the solver may be numerically stable while the GC composition or C6+ characterization dominates the final dew-point uncertainty.
That last point is especially important for hydrocarbon dew point. Heavy hydrocarbons drive HCDP. Small changes in the C6+ split or in how C7, C8, C9, and heavier pseudo-components are represented can move the calculated cricondentherm more than the numerical tolerance of the solver ever will. In that situation, arguing about solver precision misses the actual uncertainty source.
Where certified measurement wins
Certified measurement wins when the number must be defensible outside the control room.
For custody transfer, contract enforcement, regulatory reporting, and formal dispute resolution, a traceable measurement from a qualified laboratory or inspection provider is usually the authoritative record. International inspection and testing organizations such as Bureau Veritas, SGS, Intertek, or equivalent accredited providers are commonly used in this kind of role. The specific provider matters less than the chain of custody, calibration status, method statement, and acceptance by the contract or regulator.
Names are listed as commonly recognized examples in the industry. KYCIS has no commercial relationship with these providers.
This is the correct place for measurement to be strongest. A calculation can support the discussion, explain a trend, or identify why an event likely occurred, but it is rarely the legal instrument by itself. If a shipper and a pipeline operator disagree about whether a gas stream met a water or hydrocarbon dew-point specification at a delivery point, the formal answer normally comes from the agreed measurement and sampling procedure.
Measurement is also strongest during commissioning and acceptance testing. When a new source enters a pipeline system, a new dehydration train is commissioned, or a new gas chromatograph method is introduced, a measured reference point helps establish whether the real-time calculation pipeline is grounded in reality. That measured reference does not need to run every second. Its value is that it anchors the system.
The limitation is cadence. A certified lab result is often delayed. Even a field test that is performed correctly captures a point in time. It cannot continuously follow blend changes, operating-pressure changes, or transient cold spots. Measurement gives authority. It does not automatically give continuous situational awareness.
Where real-time calculation wins
Real-time calculation wins when the number must be available continuously, consistently, and fast enough to influence operations.
A SCADA system does not need a courtroom-grade certificate every second. It needs a stable margin: how far the current operating point is from hydrocarbon liquid dropout, water condensation, hydrate risk, or an alarm threshold. It needs to trend that margin as gas composition changes. It needs to raise a flag before the pipeline reaches a condition that a lab result will only confirm later.
This is where Peng-Robinson calculation from GC composition is powerful. A real-time engine can take the latest composition, pressure, and temperature; calculate hydrocarbon dew point, water dew point, or a phase envelope; and write the result back as a historian tag. Operators can then alarm on margin rather than on raw temperature alone. Engineers can review trends instead of isolated tests. Compliance teams can see whether an excursion was a one-off measurement issue or part of a sustained operating pattern.
This does not make real-time calculation a replacement for certified measurement. It makes it the operating layer between certified measurements.
For pipeline operation, that distinction is decisive. The best use of real-time calculation is not to claim that the lab is obsolete. It is to reduce the number of surprises that reach the lab in the first place.
Why measurement and calculation disagree
When a measured dew point and a calculated dew point disagree, the least useful response is to ask which method is “wrong.” The useful response is to align the basis of comparison.
Common causes of disagreement
Common causes of disagreement include:
- The measurement and calculation are not using the same pressure basis.
- The sample time does not match the GC composition timestamp.
- The lab composition and online GC composition use different normalization rules.
- The C6+ or C7+ split is different between the lab report and the process GC method.
- The water dew point and hydrocarbon dew point are being compared as if they were the same quantity.
- The chilled mirror detected water, glycol, compressor oil, or hydrocarbon liquid differently than expected.
- The instrument was calibrated under conditions that do not represent the installed field sampling system.
- The EOS model is being asked to extrapolate beyond the composition quality available.
Most reconciliation work is therefore data engineering before it is thermodynamics. The pressure, timestamp, composition basis, component list, dry/wet basis, and heavy-end characterization must be aligned before the methods can be compared fairly. In practice, many persistent offsets are resolved at this basis-alignment step before any change to the thermodynamic model is justified.
That is why DPCloud’s calculation result should be treated as auditable engineering output. The value is not just the dew-point number. It is the ability to reproduce which composition, pressure, temperature, component set, and model settings produced that number.
A practical reconciliation workflow
When a lab or field measurement disagrees with the real-time calculation, use a structured reconciliation workflow instead of debating the methods in isolation.
- Start with the reported disagreement. Confirm which measured value and which calculated value are being compared.
- Identify the dew-point type. Confirm whether the comparison is water dew point, hydrocarbon dew point, or cricondentherm hydrocarbon dew point.
- Align the pressure basis. A dew point without pressure is incomplete. Confirm whether both values refer to line pressure, test pressure, or a pressure-converted basis.
- Normalize timestamp and composition. Match the measurement time to the GC composition time, operating-pressure time, dry/wet basis, mole percent basis, and inert handling.
- Reconstruct the heavy end. For hydrocarbon dew point, confirm how C6+, C7+, and heavier pseudo-components are split.
- Re-run the EOS calculation. Use the aligned composition and pressure basis.
- Compare the measured dew point, calculated dew point, and phase-envelope features on the same basis.
- Classify the offset. Attribute the remaining difference to sampling, instrument behavior, composition uncertainty, heavy-end characterization, or EOS/model limitations.
This workflow is deliberately conservative. It avoids the easy but misleading conclusion that a single disagreement proves either the measurement or the calculation is bad. In pipeline work, a disagreement is often a clue that two different physical or data bases are being compared.
A decision matrix for pipeline teams
The following matrix is the practical rule we recommend.
| Situation | Primary answer to trust | Supporting answer | Why |
|---|---|---|---|
| Custody-transfer dispute | Certified measurement | EOS calculation | Measurement is contractually and legally defensible |
| Regulatory or compliance report | Certified measurement | Real-time trend history | The report needs traceability; trends explain operating context |
| Daily SCADA monitoring | Real-time calculation | Periodic measurement | Operators need continuous margin, not delayed confirmation |
| Alarm and control logic | Real-time calculation | Commissioning measurement | The control system needs a value every scan cycle or every GC cycle |
| New gas source or blend change | Both | Both | Measurement anchors the method; calculation watches the transition |
| Persistent lab/calculation offset | Reconciliation workflow | Both | The offset may come from pressure, timestamp, sampling, composition, or C6+ basis |
| Model validation project | Certified measurement set | EOS calculation across the same basis | Validation requires paired, basis-aligned data |
The short version is simple:
Trust certified measurement for formal proof. Trust real-time calculation for operating margin. Trust neither blindly when the basis is not aligned.
That sentence is the core of this article.
What DPCloud should and should not claim
DPCloud should not claim to replace ISO 18453, ASTM D1142, chilled-mirror measurement, certified labs, or third-party custody-transfer procedures. Those methods exist for a reason, and in formal disputes they carry authority that a live calculation does not.
What we claim
DPCloud should claim something more specific and more useful: continuous, auditable, composition-driven dew-point and phase-envelope calculation for pipeline operations.
That means:
- Calculating hydrocarbon dew point and phase-envelope features from the latest available gas composition.
- Supporting water dew-point workflows where composition, pressure, and water-content basis are available.
- Writing calculated margins into SCADA and historian systems.
- Giving engineers a reproducible basis for why a value changed.
- Helping operators act before a periodic measurement becomes a post-event explanation.
This is why calculation speed matters, but speed alone is not the product. The useful product is a stable engineering signal that operations can trend, alarm on, and reconcile against measurement when needed.
What we do not claim
DPCloud is not a replacement for certified laboratory measurement, agreed custody-transfer test methods, or third-party inspection procedures. It is the operational calculation layer that helps pipeline teams understand what is happening between those formal measurement points.
For the model-choice side of that signal, see our comparison of Peng-Robinson, SRK, and AGA8 for natural-gas phase-envelope calculation. For the physical difference between water and hydrocarbon dew point, see Hydrocarbon Dew Point vs. Water Dew Point.
Conclusion: use the right truth for the right decision
Measurement and calculation are not enemies. They are two truth sources with different authority.
A certified measurement is the right truth when the organization needs a defensible record: custody transfer, contract compliance, commissioning, and formal dispute resolution. A real-time calculation is the right truth when the organization needs operating awareness: dew-point margin, SCADA alarming, composition-change response, and trend visibility between measurements.
The most reliable pipeline programs use both. They use measurement to anchor and defend the standard. They use calculation to watch the system continuously. The best operators do not choose between measurement and calculation; they use both in their proper domains. When the two disagree, they reconcile the basis instead of declaring a winner too early.
That is the engineering position DPCloud is built around. Certified measurement tells you what can be defended. Real-time calculation tells you what is happening now.
Try this on your own composition
The cleanest way to evaluate a dew-point calculation workflow is to run it against a gas composition you already understand. Use the DPCloud demo to compare hydrocarbon dew point, water dew point, and phase-envelope behavior, then decide what measurement data you would use to validate the result.
References for Fact Checking
- ISO 18453:2004, official ISO abstract: Natural gas – correlation between water content and water dew point. The ISO page states that the method was developed by GERG and that the standard gives uncertainty for the correlation but does not quantify measurement uncertainty. Access the ISO standard page.
- GERG TM14: Relationship Between Water Content and Water Dew Point Keeping in Consideration the Gas Composition in the Field of Natural Gas. GERG describes this monograph as the basis for the GERG standard method used for water dew point and water content calculations. Access the GERG technical monograph list.
- ASTM D1142-95(2021): Standard Test Method for Water Vapor Content of Gaseous Fuels by Measurement of Dew-Point Temperature. Access the ASTM standard page.
- ISO/TR 12148:2009: Natural gas – calibration of chilled mirror type instruments for hydrocarbon dewpoint. Access the ISO technical report page.
- PRCI, Development of Accurate Methods for Predicting Hydrocarbon Dew Points. PRCI notes the operational appeal of GC-based analytical dew-point determination and the need for accurate heavy-end characterization when extended analysis is unavailable. Access the PRCI key result.
- PRCI project PR-663-19600-Z01, Develop Guidance for Calculation of HCDP in Natural Gas Pipelines. The project description frames HCDP compliance as demonstrated through in-situ testing or EOS-based predictive models. Access the PRCI project page.
- NIST hygrometer calibration overview for traceable chilled-mirror and humidity instrument calibration context. Access the NIST calibration page.
- Process Sensing / Michell S8000 and other chilled-mirror instrument datasheets commonly state laboratory-grade dew/frost point accuracy around ±0.1 °C under specified conditions. Use as instrument-spec examples, not as field-system guarantees. Access the Process Sensing datasheet page.
- Edgetech DewMaster chilled-mirror hygrometer datasheet states ±0.2 °C standard and ±0.1 °C optional dew/frost point accuracy. Use as a manufacturer specification example, not a universal installed uncertainty. Access the Edgetech datasheet page.