Validation is not a single accuracy number
Hydrocarbon dew-point software should not be trusted because a result looks plausible. It should be trusted because the calculation basis can be compared against measured data in a controlled way. For pipeline gas-quality teams, that distinction matters. A dew-point number may influence operating margin, winter risk screening, compressor protection, custody-transfer discussions, and the way engineers interpret gas chromatograph data.
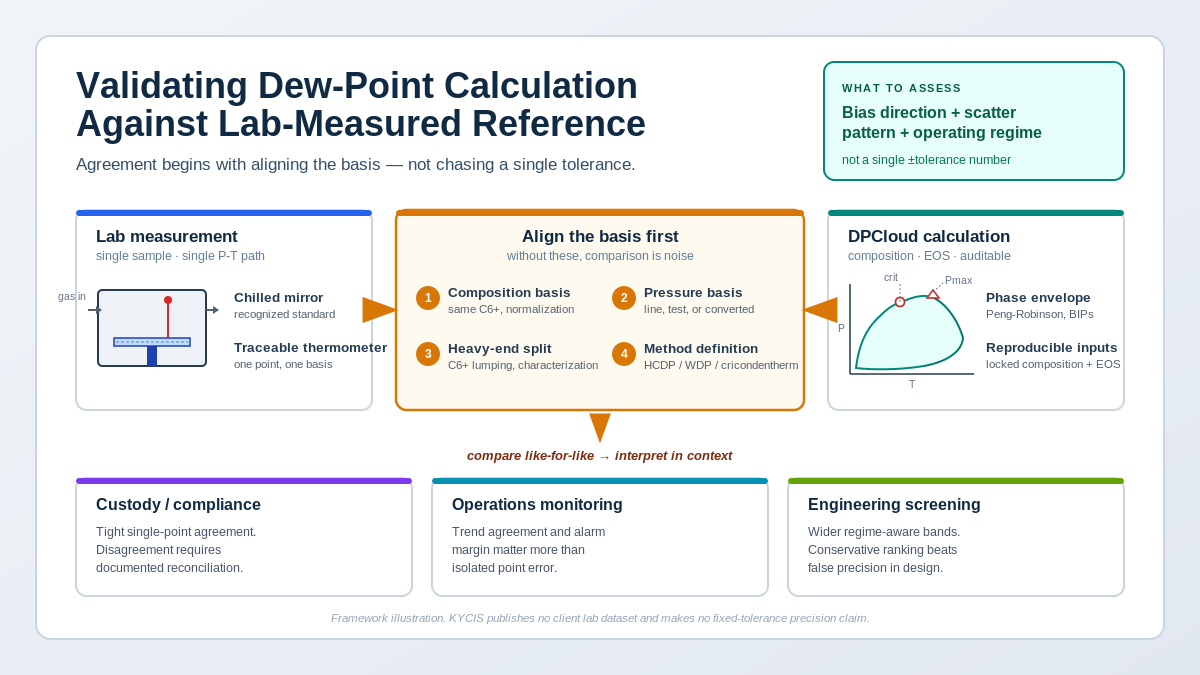
This article is about dew point calculation validation. It does not claim that DPCloud matches every lab-measured dew point within a fixed temperature band. That would be the wrong claim. The useful question is more practical: when a lab-measured dew point and an equation-of-state calculation are compared, what has to be fixed first, what does agreement really mean, and how should disagreement be diagnosed?
The previous KYCIS article on dew-point measurement versus real-time calculation explained when certified measurement, chilled mirrors, ISO 18453 water-dew-point correlation, and real-time Peng-Robinson calculation answer different questions. This article continues that trust theme. It focuses on the validation workflow that sits between measurement and calculation.
The central point is simple: before judging a model, align the basis of comparison.
What lab-measured dew point actually validates
A lab-measured dew point is not a universal truth detached from context. It is an observation made on a particular gas sample, under a particular pressure basis, using a particular method, at a particular time. A chilled-mirror hydrocarbon dew-point test, a visual-cell observation, an online analyzer reading, and a laboratory report may all be useful, but they are not interchangeable unless the method and basis are understood.
For hydrocarbon dew point, the measured value usually answers this question: at the stated pressure and method conditions, when was the first visible or instrument-detected hydrocarbon liquid observed? For water dew point, the method may instead be tied to water content, moisture analyzer response, or a correlation such as ISO 18453. Those are different physical questions. A water-dew-point measurement does not validate hydrocarbon liquid dropout, and a hydrocarbon-dew-point calculation does not validate water content.
A lab comparison therefore validates the whole chain, not only the solver. It tests whether the sample, GC composition, heavy-end characterization, binary interaction assumptions, pressure basis, dew-point definition, and equation of state are coherent enough for the intended decision. If the chain is not coherent, a measured point and a calculated point can disagree even when both were produced competently.
That is why hydrocarbon dew point validation should be treated as an engineering reconciliation exercise rather than a software demo.
Fix four things before comparing numbers
A measured dew point and a calculated dew point are comparable only after four bases are fixed.
Composition basis
The calculation must use the composition that corresponds to the measured sample. That sounds obvious, but it is often where validation fails. A laboratory sample may have been collected hours or days before the online GC cycle being used for the calculation. The lab report and the process GC may also use different normalization rules, dry/wet bases, inert handling, or C6+ reporting conventions.
If the composition basis is not locked, the comparison is weak. The model may be blamed for a difference that actually entered through sample timing or composition handling.
Pressure basis
Dew point is pressure dependent. A hydrocarbon dew point at line pressure, a laboratory test pressure, a cricondentherm, and a pressure-converted value are not the same number. The pressure basis must be stated explicitly before the comparison begins.
This is especially important when someone asks how to validate dew point calculation against lab data. The lab may report a result at a specified pressure. The control room may be looking at the current operating pressure. The engineering team may care about a pressure sweep or the maximum temperature on the dew curve. All three can be legitimate, but only one can be compared at a time.
Heavy-end characterization
Hydrocarbon dew point is sensitive to the heavy end. Small differences in C6+, C7+, C8, C9, and heavier pseudo-component handling can move the calculated phase envelope more than the numerical tolerance of the solver. A validation exercise should therefore state how the heavy end is represented, whether the same split is used in the lab and calculation, and whether the gas falls inside the expected component range.
This is also where upstream data quality becomes a separate problem. GC composition uncertainty and heavy-end propagation are large enough topics to deserve their own article. W10 in this series will focus on how uncertainty moves from GC composition to dew-point result.
Method definition
Finally, the team must agree on the definition being compared. Is the lab result a water dew point, hydrocarbon dew point, cricondentherm, or another reported property? Is the calculation using Peng-Robinson, SRK, GERG, or a project-specific thermodynamic basis? Is the comparison about first liquid onset, a quality-line threshold, or an operating alarm margin?
For more context on equation-of-state selection, see the KYCIS article on Peng-Robinson, SRK, and AGA8 in natural-gas dew-point calculations. EOS choice is not a cosmetic detail. It changes what the model is designed to predict.
Disagreement is a diagnostic signal, not a verdict
When lab measurement and EOS calculation disagree, the least useful conclusion is “the lab is wrong” or “the model is wrong.” The useful question is: which layer explains the residual after the comparison basis has been aligned?
Measurement-side and data-side causes include sample handling, pressure-control differences, chilled-mirror interpretation, analyzer calibration, mirror contamination, timestamp mismatch, wet/dry basis confusion, and C6+ characterization differences between lab and process methods. These are common in real field workflows, and they can dominate the apparent error.
But a balanced validation process also admits model-side limitations. If the composition falls outside the component library or contains unusual heavy-end behavior, if the gas is near the critical region or near the cricondentherm where small input changes produce large dew-point movement, or if default binary interaction parameters are used where project-fit BIPs are needed, the model can be the limiting layer.
This is the same honest posture used in the earlier KYCIS discussion of cricondentherm hydrocarbon dew point versus water dew point. A calculation service is useful because it is reproducible and fast. It is not magic. It still depends on the physical and data assumptions supplied to it.
Bias and scatter tell different stories
A validation set should not be reduced to one average error number too early. Two diagnostic patterns matter more: bias and scatter.
Bias is a systematic offset. If the calculation is consistently warmer or consistently colder than the lab measurements across comparable cases, the cause may be a pressure-basis mismatch, a heavy-end characterization issue, a consistent GC method difference, or BIP assumptions that are not fit for that gas family. Bias is valuable because it points toward a correctable basis or model issue.
Scatter is random spread. If some comparisons are high, some are low, and the pattern follows sample timing, repeatability, operating instability, or field analyzer condition, the dominant issue may be sampling and measurement repeatability rather than the thermodynamic model. Scatter asks for more controlled data before changing the model.
The second diagnostic pattern is regime-dependent error. Lean pipeline gas, rich gas near liquid dropout, and conditions near the cricondentherm should not be judged with identical expectations. Lean gas may show stable agreement because the heavy-end sensitivity is lower. Rich gas can be more sensitive to small changes in C6+ and C7+ handling. Near-cricondentherm conditions can amplify both measurement and model uncertainty because the phase boundary is locally flat or turning.
This does not require publishing a universal tolerance. In fact, a universal tolerance can be misleading. A practical validation report should state the regime, the data basis, the observed bias, the observed scatter, and the operating decision the comparison is meant to support.
| Pattern | What it often suggests | What to check next |
|---|---|---|
| Consistent warm or cold offset | Systematic bias in basis, BIP, or heavy-end handling | Pressure basis, C6+ split, BIP set, EOS choice |
| Wide random spread | Sampling or repeatability limitation | Sample chain, timestamp match, instrument condition |
| Error grows for rich gas | Heavy-end sensitivity is dominating | C7+ split, pseudo-components, lab GC method |
| Error grows near cricondentherm | Phase-envelope geometry is amplifying uncertainty | Pressure sweep, local slope, comparison definition |
A practical validation workflow
The following workflow keeps the validation conversation disciplined.
- Collect representative lab-measured dew points and the corresponding sample records.
- Identify whether each point is water dew point, hydrocarbon dew point, cricondentherm, or another property.
- Match each lab point to the correct GC composition, sample time, and pressure basis.
- Normalize the composition basis, including dry/wet basis, mole fraction closure, inerts, and heavy-end representation.
- Run DPCloud with the locked composition, pressure basis, equation-of-state setting, and BIP basis.
- Compare by operating regime instead of only calculating one overall average error.
- Separate systematic bias from random scatter.
- Document the residual and decide whether the next action is data cleanup, more lab points, BIP fitting, or operating tolerance setting.
This workflow also prevents overfitting. If a single lab point is used to tune a model, the model may appear better for that point while becoming worse for the operating envelope. Validation should ask whether the basis works across the relevant gas families and pressure ranges, not whether one number can be forced to match.
Choose validation points that cover the operating envelope
A useful validation set is not simply the largest available set of lab reports. It is a set that represents the operating regimes where the calculation will be used. A pipeline that receives one stable lean gas stream does not need the same validation strategy as a system that blends rich associated gas, lean sales gas, recycled residue gas, and seasonal imports. The point is to test the decision envelope, not to collect random examples.
For hydrocarbon dew point, the validation points should include the gas families and pressure ranges that drive operating risk. If winter operations are the main concern, points near the cold-weather pressure and temperature envelope matter more than summer conditions far from liquid dropout. If custody-transfer disputes are the main concern, the validation set should align with the pressures and methods named in the commercial specification. If compressor suction protection is the concern, the comparison should focus on the gas compositions and pressure reductions that can create liquid carryover risk.
It is also useful to include deliberate contrast. A lean gas case, a richer gas case, and a case near the cricondentherm teach more than three nearly identical lean-gas samples. The lean case checks that the calculation behaves normally where heavy-end sensitivity is low. The richer case tests whether the heavy-end representation is adequate. The near-cricondentherm case tests the region where small changes in pressure, temperature, or composition can move the apparent dew-point result more dramatically.
This is where validation becomes different from benchmarking. Benchmarking often asks which software returns the same answer fastest. Validation asks whether the chosen calculation basis supports a real operating workflow. The answer depends on the gas, the pressure range, the measurement method, and the consequence of being wrong.
Do not tune the model until the data basis is clean
One tempting response to disagreement is to adjust the model immediately. That can be a mistake. If the lab sample, online GC composition, pressure basis, and heavy-end split are not aligned, tuning the model may only hide a data problem. The tuned model then carries that hidden problem into live operations.
A conservative sequence is better. First, confirm that the same physical property is being compared. Second, confirm the pressure basis. Third, confirm that the composition belongs to the measured sample and that the heavy end is represented consistently. Fourth, run the calculation with a documented BIP basis. Only after those steps should the team ask whether project-specific BIP fitting or another model adjustment is justified.
There are valid reasons to use project-specific BIPs. A customer may have experimental PVT data, a known gas family, or a long history of lab comparisons that supports a fitted thermodynamic basis. In that case, the fitted BIPs become part of the validated basis and should be managed like engineering configuration, not like a casual software preference. The important rule is traceability: know which BIP set was used, why it was selected, and which validation points support it.
This matters for live systems because configuration drift can look like physics. If the lab comparison used one BIP basis but the SCADA-facing calculation uses another, a future disagreement may not be a measurement issue or an EOS issue. It may simply be a configuration-management issue. The validation record should therefore include the component list, heavy-end method, BIP source, software version, and calculation endpoint used for the comparison.
Where DPCloud fits in the validation stack
DPCloud is a calculation service. It is not a direct measurement instrument and it should not be presented as a substitute for an accepted custody-transfer test. Its role in validation is to make the calculation side reproducible, fast, and auditable.
In a validation workflow, DPCloud can be run against a locked composition and pressure basis, using a known component set and BIP configuration. The same calculation core can then be used in a live operational deployment, whether the deployment is an on-premises Windows Service or a container-based API. That matters because the validated basis does not remain trapped in an offline spreadsheet. It can become the same calculation basis used for SCADA-facing alarms and historian trends.
For operating use, that is the bridge between lab confidence and real-time action. A lab point can anchor the basis. DPCloud can apply that basis continuously as the gas composition and operating pressure change. The earlier KYCIS article on sub-150 ms dew-point calculations explains the latency side of that bridge. The article on cold-spot prediction in winter pipeline operations shows why a validated EOS basis matters when the calculation is used to rank local operating margin.
The important constraint is transparency. If a customer uses project-specific BIPs, a custom heavy-end split, or a constrained component set, those choices should be documented as part of the validation basis. A result is more defensible when the inputs and assumptions can be reconstructed.
What agreement should mean
Agreement should mean that the measured and calculated dew points are close enough, on a controlled basis, for the intended engineering decision. It should not mean that one fixed tolerance applies to every gas, every pressure, every method, and every operating regime.
For custody-transfer and formal compliance decisions, the accepted measurement method and contract language usually control the answer. Calculation can explain and support, but it normally does not replace the agreed evidence. For operational monitoring, calculation is often the better continuous tool because it can update on the same cadence as the GC and SCADA data. For engineering screening, the right question may be whether the calculated trend, phase-envelope shape, and bias direction make physical sense across the relevant operating envelope.
That is the difference between a validation culture and a precision claim. A precision claim says “the software is accurate to X.” A validation culture says “here is the basis, here is the measured comparison, here is the bias, here is the scatter, here is the regime, and here is the decision this supports.”
If you have lab dew-point data, GC compositions, and a need to compare them against a live calculation basis, contact KYCIS. We can help scope a DPCloud comparison workflow that keeps the measurement role, the calculation role, and the operating decision separate.
References
- ISO, ISO 6976:2016, Natural gas – Calculation of calorific values, density, relative density and Wobbe indices from composition.
- GERG, Technical Monograph TM14, Relationship Between Water Content and Water Dew Point Keeping in Consideration the Gas Composition in the Field of Natural Gas.
- ASTM International, ASTM D5454-11(2020), Standard Test Method for Water Vapor Content of Gaseous Fuels Using Electronic Moisture Analyzers.
- G. Fandiño et al., Hydrocarbon Dew Point Measurement and Model Evaluation of Synthetic and Real Natural Gases, ACS Omega, 2020.
- M. A. A. Nazeri et al., Measurement of the Hydrocarbon Dew Point of Real and Synthetic Natural Gas Mixtures by Direct and Indirect Methods, Energy & Fuels, 2009.
- S. Avila et al., Measurement and modeling of hydrocarbon dew points for five synthetic natural gas mixtures, Fluid Phase Equilibria, 2006.
- D. G. Brown et al., Measurement and prediction of dew point curves of natural gas mixtures, Fluid Phase Equilibria, 2013.
- KYCIS, Dew Point Measurement vs Real-Time Calculation: ISO 18453, Chilled Mirrors, and When to Trust Which.