A public benchmark is more useful than a perfect-looking number
Hydrocarbon dew-point validation is most useful when the data can be inspected. Private lab comparisons are valuable for project work, but a public benchmark adds a different kind of discipline: readers can see the source, understand the assumptions, and decide whether the comparison is relevant to their own gas-quality problem.
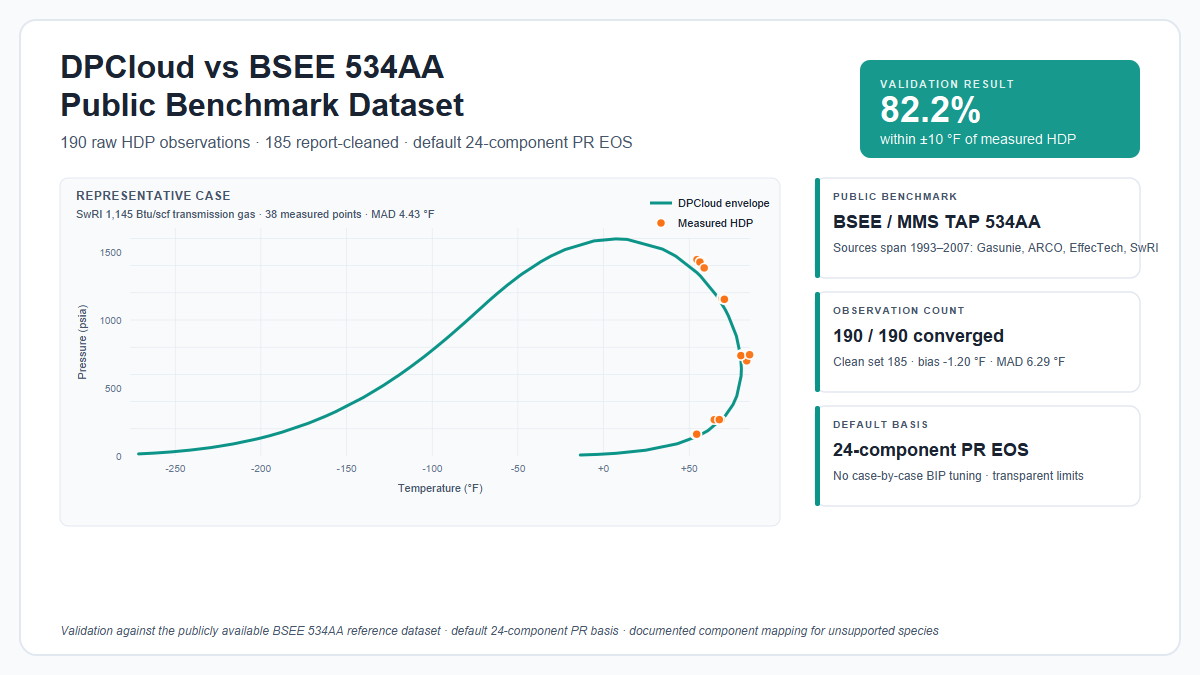
This article compares DPCloud against 190 hydrocarbon dew-point observations extracted from the publicly available BSEE/MMS TAP 534AA report, Development of Accurate Methods for Predicting Hydrocarbon Dew Points. The point is not to claim zero error; no engineering model achieves that. The point is to show where a default Peng-Robinson calculation follows measured data, where systematic bias appears, and where heavy-end assumptions matter most.
For private lab-data validation concepts, see the KYCIS article on validating DPCloud against lab-measured dew points. This article is different: it uses a public BSEE reference dataset that any reader can inspect and reproduce.
The value of a public benchmark is not that it produces zero error. It is that it exposes where a calculation agrees, where it biases, and which assumptions explain the boundary.
What was compared
The BSEE 534AA report brings together several experimental and modeling efforts around natural-gas hydrocarbon dew point, C6+ characterization, and equation-of-state prediction. The broader report references independent laboratory work spanning Derks/Gasunie PHLC data from 1993, Warner/ARCO hydrocarbon dew-point data from 2001, EffecTech commercial gas data from 2002, and SwRI/George-Burkey measurements from 2005-2007. That breadth matters. It makes the report more useful than a single hand-picked validation case.
For this DPCloud comparison, only directly tabulated hydrocarbon dew-point observations were used. PHLC-only rows were kept in the structured dataset but excluded from the HDP comparison because the report does not provide a directly tabulated measured HDP value for those rows.
One additional distinction matters. DPCloud was run against all 190 tabulated HDP observations, and all 190 converged. The report itself marks five observations as judged outliers and removes them from the final dataset: data points 15 and 16 in the SwRI 1,050 Btu/scf 2005b table, data points 1 and 23 in the SwRI 1,325 Btu/scf 2005c table, and data point 20 in the SwRI 1,523 Btu/scf 2005c table. The headline validation discussion therefore treats the 190-point run as a raw extraction check and the 185-point report-cleaned set as the cleaner accuracy basis.
| Source group | HDP observations used in clean statistics | Role in this comparison |
|---|---|---|
| Warner et al. / ARCO | 3 | High-CO2 transmission-gas samples |
| Cowper / EffecTech | 10 | Commercial gas samples with detailed heavier-end reporting |
| George / George-Burkey SwRI data | 172 | Multi-pressure loci across lean, transmission, rich, and very rich gases; five report-flagged outliers excluded from clean statistics |
| Total | 185 | 190 raw tabulated observations converged; 185 used after applying the report’s outlier exclusions |
The calculations used the current default DPCloud component basis. Unsupported aromatics, cycloalkanes, and many C6+ isomers were mapped into the available normal-alkane basis for this run. Trace C15/C16 entries were aggregated to n-C14 because the default library ends at n-C14. That mapping is not a footnote. It is part of the validation basis.
Raw convergence first, report-cleaned accuracy second
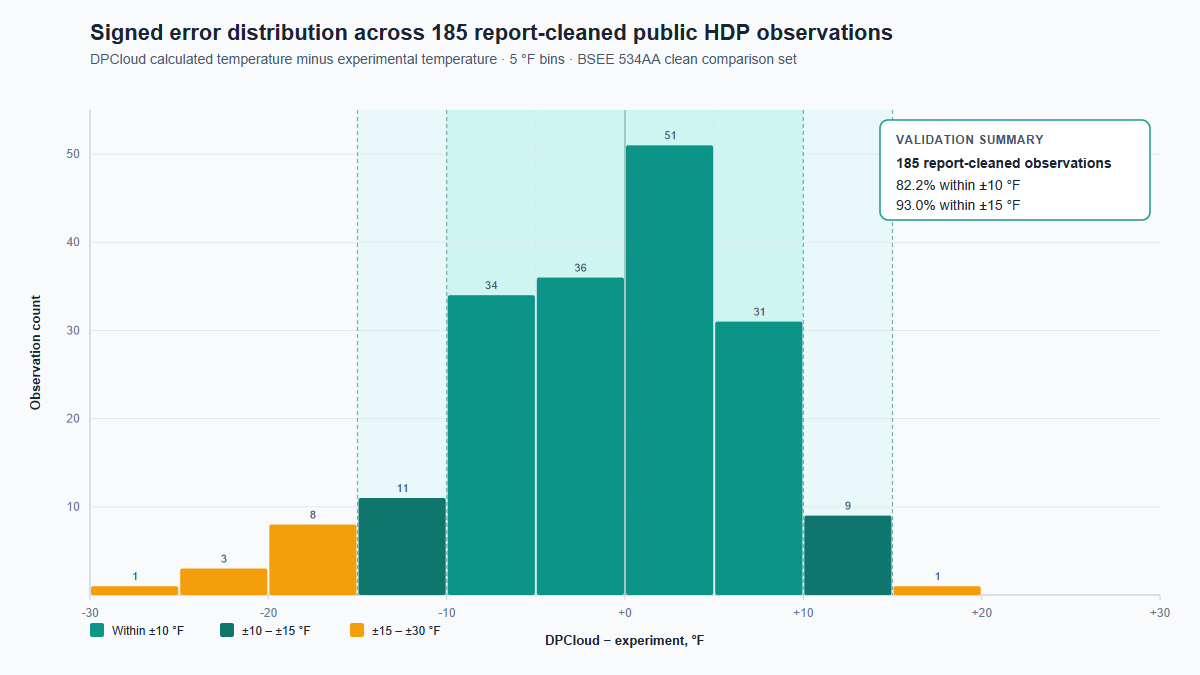
Across the 190 tabulated public HDP observations, DPCloud converged on every case. After applying the report’s own five-point outlier exclusion, the clean comparison contains 185 observations. On that report-cleaned basis, the mean difference, calculated as DPCloud temperature minus experimental temperature, was -1.20 °F. The mean absolute difference was 6.29 °F, and the median absolute difference was 5.36 °F.
The practical distribution is more useful than the mean: 87 of 185 report-cleaned observations were within ±5 °F, 152 of 185 were within ±10 °F, and 172 of 185 were within ±15 °F. The maximum absolute difference in the report-cleaned set was 25.54 °F.
This is the right level of claim for a public engineering benchmark. It does not say every gas is easy. It says the default calculation basis follows most of the measured data while also exposing where richer chemistry and pressure-region sensitivity matter.
Phase-envelope overlay: representative transmission gas
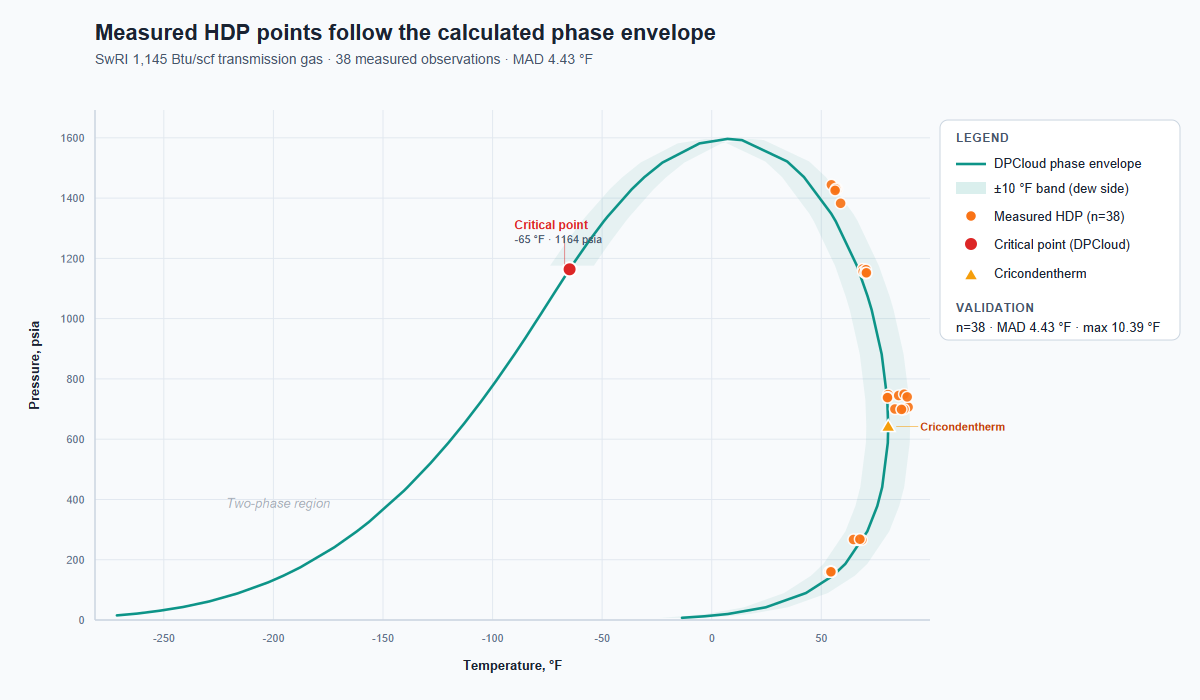
A table of errors is useful, but phase behavior is easier to judge on a pressure-temperature plot. For the representative overlay, the SwRI_1145_2005b sample was used. This is not a single favorable point. It is a 38-observation pressure locus for a medium-Btu/scf gas, making it a practical transmission-gas-style validation case.
The figure plots the complete DPCloud-calculated phase envelope for this gas, with the 38 measured HDP points overlaid as orange markers. The critical point and cricondentherm of the calculated envelope are shown to make the shape easy to read. A light teal band shows ±10 °F around the dew side of the calculated curve.
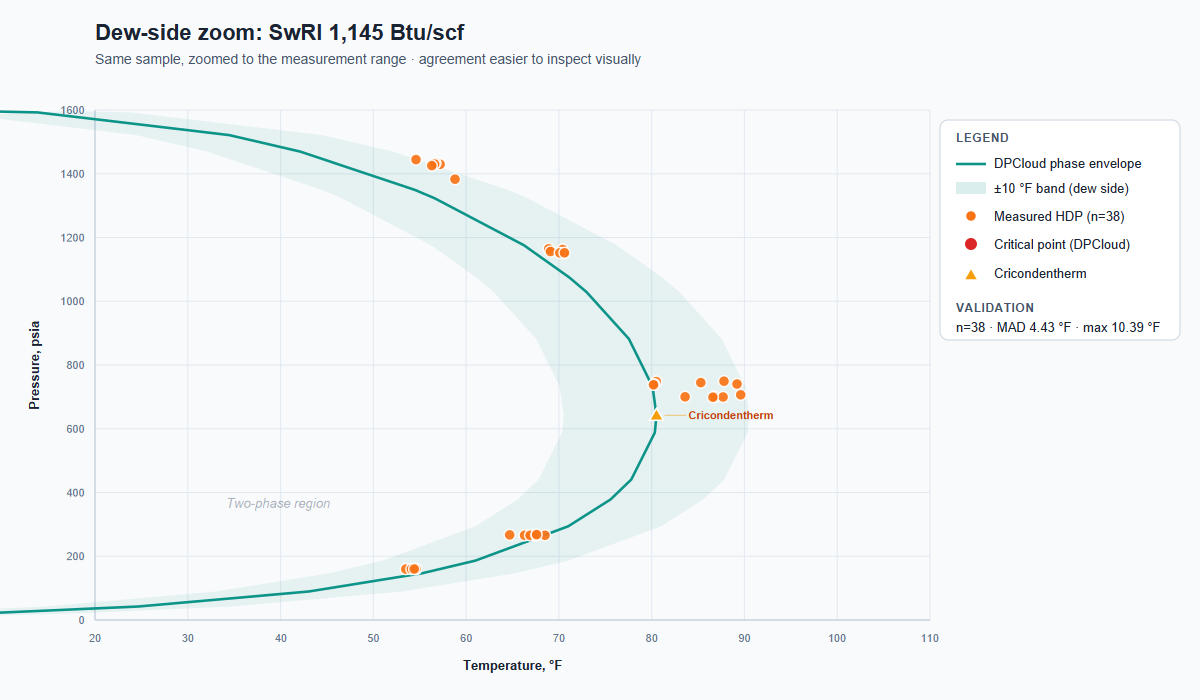
The same comparison is easier to inspect in a dew-side zoom. At this scale the agreement between calculation and measurement is visible point by point, and the limits of the ±10 °F band are easy to read.
Pressure bins show where the pattern changes
Overall statistics are only the first pass. When the data are grouped by pressure range, the pattern becomes more informative. The 200-1000 psia region is the cleanest range in this comparison. The 1000-1400 psia bin shows a repeatable cold-bias pattern, especially in rich-gas cases.
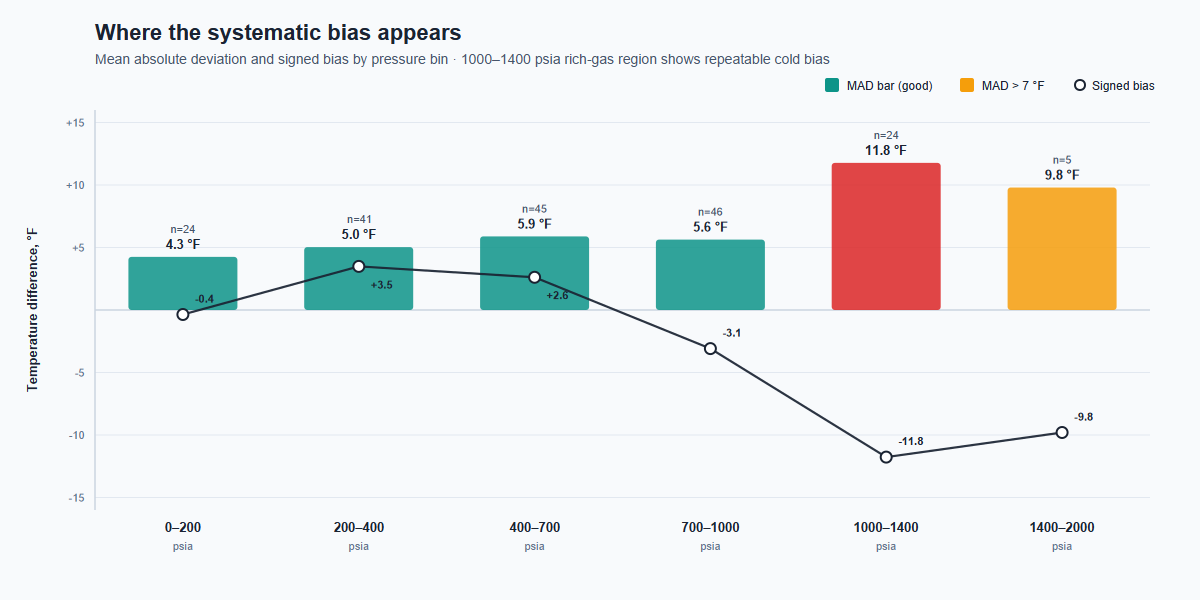
| Pressure bin, psia | n | Bias, °F | Mean absolute difference, °F | Max absolute difference, °F |
|---|---|---|---|---|
| 0-200 | 24 | -0.36 | 4.25 | 11.27 |
| 200-400 | 41 | +3.49 | 5.04 | 11.11 |
| 400-700 | 45 | +2.62 | 5.88 | 16.66 |
| 700-1000 | 46 | -3.09 | 5.63 | 14.77 |
| 1000-1400 | 24 | -11.77 | 11.77 | 25.54 |
| 1400-2000 | 5 | -9.80 | 9.80 | 10.39 |
For high-confidence dew-point work at the operating extremes of this dataset, especially rich gas above roughly 1000 psia, calculation trends should be paired with periodic chilled-mirror or lab cross-checks. That is not a weakness of using calculation. It is how calculation and measurement should be combined when the gas is near a sensitive region of the phase envelope.
Why a Peng-Robinson calculation can show systematic bias
A systematic bias does not mean the calculation failed to converge. It usually means the EOS basis, binary interaction parameters, or heavy-end characterization are carrying a repeatable assumption across a family of similar gases.
Peng-Robinson is a practical cubic equation of state, not a point-fitted model for every rich-gas dew boundary. At a dew point, the calculation is solving a fugacity-balance boundary problem. Near sensitive regions of the dew curve, small repeatable differences in K-values, binary interaction parameters, critical properties, or composition can become several degrees of temperature difference.
Heavy-end characterization matters strongly for hydrocarbon dew point. Aromatics, cycloalkanes, detailed C6+ isomers, and C15/C16+ species can affect the dew curve more than their molar fractions suggest. If those species are simplified into a default normal-alkane basis, the calculation becomes easier to deploy and easier to map from common GC data, but some rich-gas cases will show directional bias.
This is not unique to DPCloud. Most cubic EOS implementations can show similar directional bias when C6+ chemistry is simplified, binary interaction parameters are left untuned, or rich-gas heavy ends are represented by a compact default component basis.
This comparison intentionally uses the default DPCloud basis. It does not retune binary interaction parameters case by case to make a public benchmark look cleaner. That choice is closer to real production use: SCADA and GC workflows need a stable calculation basis, documented assumptions, and clear rules for when the component model should be extended.
DPCloud treats the default 24-component Peng-Robinson basis as a practical operating model, while allowing richer project-specific component libraries when the gas chemistry justifies the extra complexity.
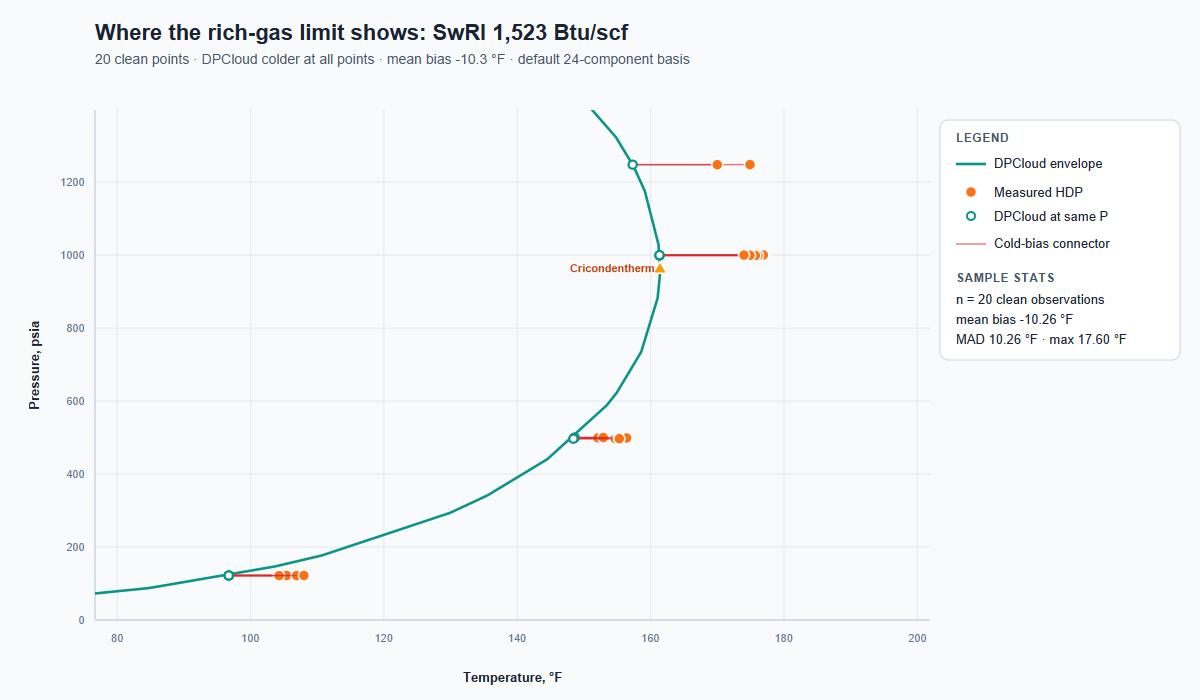
The very-rich SwRI 1,523 Btu/scf gas makes that pattern visible at the level of a single sample. After removing the one observation that the BSEE report flags as an outlier for this gas, the report-cleaned sample contains 20 measured HDP observations. Every measured point sits warmer than the DPCloud-calculated temperature at the same pressure. The mean bias is -10.26 °F and the mean absolute difference is also 10.26 °F, which means the bias is the entire error budget for this sample. There is no random scatter cancelling out; the gas is systematically biased cold under the default 24-component basis.
Why the largest raw difference is excluded from the clean comparison
The largest raw difference in the extraction is SwRI_1325_2005c_run23: 98.8 psia, experimental HDP of 123.9 °F, and DPCloud calculated HDP of 68.67 °F. The difference is -55.23 °F. The important detail is not the size of the difference; it is that the BSEE 534AA report itself flags this measurement as one of five outliers removed from the final dataset.
That is why this article reports two different facts separately: DPCloud converged on all 190 raw tabulated HDP observations, but the accuracy statistics use the same 185-point report-cleaned basis used by the source document. The excluded point is therefore a source-data handling issue, not a model-performance claim.
The practical lesson is simple: validation should preserve source-data flags. A calculation comparison is only as defensible as the measurement set being compared, and paper-flagged outliers should not be silently folded into model-accuracy conclusions.
Default library first, extended chemistry when needed
The default DPCloud component basis exists for a reason. Many pipeline and SCADA-facing workflows need reliable calculations from common GC outputs, not a fragile site-specific chemistry model that is difficult to maintain. A compact default library makes tag mapping, deployment, and operations support simpler.
That does not mean the default library is the only possible basis. For rich-gas projects where aromatics, cycloalkanes, detailed C6+ isomer splits, or heavier C15/C16+ species materially affect the dew point, DPCloud can be extended with a project-specific component library instead of forcing the default basis to carry chemistry it was not designed to represent.
That distinction is important. The default basis is the right starting point for broad usability. Expanded chemistry is the right path when the gas composition justifies the extra complexity.
Operational interpretation
For typical transmission-gas conditions in this public comparison, DPCloud follows the measured dew-point locus closely enough to support screening, alarm-margin calculation, and SCADA-facing trend logic. The SwRI_1145_2005b case is the best visual example: the measured points track the calculated phase-boundary shape, and the mean absolute difference is 4.43 °F across 38 observations.
For very rich gases, high-pressure sensitive regions, or samples where aromatics, isomers, and heavy ends are operationally important, the calculation should be validated against field or laboratory measurements. In those cases, the right answer may be a richer component library, a project-specific characterization rule, or a measurement cross-check program.
DPCloud is a calculation tool with documented assumptions, not a black-box dew-point oracle. That is the advantage: the assumptions are visible, the comparison can be reproduced, and the limits can be turned into engineering rules.
If your team has GC compositions and historian-archived dew-point readings, send them to KYCIS for a DPCloud validation comparison. The result can show whether the default component basis is enough, whether periodic measurement cross-checks are needed, or whether an expanded component library is justified for rich-gas service.
Conclusion
The BSEE 534AA comparison is useful because it shows both agreement and limits. DPCloud converged on all 190 tabulated public HDP observations. After applying the report’s own five-point outlier exclusion, the report-cleaned set contains 185 observations, has a median absolute difference of 5.36 °F, and places 82.2% of observations within ±10 °F. The representative transmission-gas locus follows measured data closely. The rich-gas and high-pressure regions show why heavy-end characterization and validation discipline still matter.
The right validation question is not only, what is the average error? The better question is, where does the model agree, where does it bias, and what assumptions explain the difference?