If you’re working in reservoir engineering, production optimization, or fluid characterization, PVT analysis is part of the foundation of almost every workflow. Yet for engineers new to the discipline — or those who learned PVT analysis as a collection of formulas rather than a physical story — the purpose and interconnection of PVT experiments can be unclear.
This guide explains what PVT analysis is, which experiments are performed, how the data is used, and where modern software tools are changing the PVT workflow.
What Is PVT Analysis?
PVT analysis (Pressure-Volume-Temperature analysis) refers to a suite of laboratory experiments performed on a representative sample of reservoir fluid — crude oil, gas condensate, or natural gas — to characterize its thermodynamic and physical properties across the range of pressures and temperatures encountered during production.
The goal is to measure how the fluid’s phase behavior (whether it exists as a single liquid, a single gas, or a mixture of gas and liquid) and physical properties (density, viscosity, gas-oil ratio, formation volume factor) change as pressure decreases from initial reservoir pressure to surface conditions.
This data is then used to:
- Build reservoir simulation models that accurately predict production behavior over the field life
- Design surface processing facilities (separators, stabilizers, pumping systems)
- Calculate original hydrocarbons in place (OOIP, OGIP)
- Plan production optimization strategies (gas injection, pressure maintenance)
- Predict pipeline and wellbore flow conditions
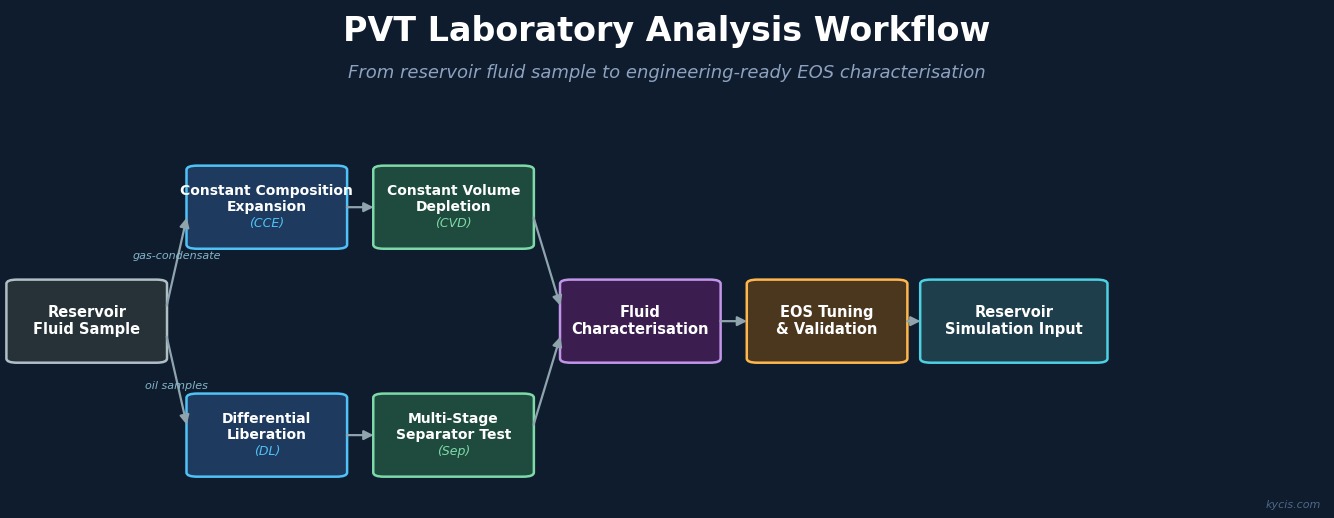
The Core PVT Experiments
1. Constant Composition Expansion (CCE)
Also called Pressure-Volume (PV) test or flash expansion. The fluid sample is held at constant reservoir temperature while pressure is reduced in steps, with no gas or liquid removed from the cell. The total volume of the cell contents is measured at each pressure step.
What it tells you:
- The bubble point pressure (for oil) or dew point pressure (for gas condensate) — the pressure at which the first phase change occurs
- The oil/liquid compressibility above the bubble point
- The two-phase compressibility below the bubble point
- The total relative volume at each pressure (used for material balance calculations)
2. Differential Liberation (DL) — for Black Oil
The fluid sample is held at reservoir temperature. At each pressure step, the pressure is reduced and the equilibrium gas is removed and measured before continuing to the next step. This simulates the depletion behavior of a solution-gas drive reservoir where gas evolved from the oil at reservoir conditions is produced separately.
What it tells you:
- Solution GOR (Rs): The amount of gas dissolved in the oil at each pressure
- Oil formation volume factor (Bo): The ratio of oil volume at reservoir conditions to stock-tank oil volume
- Oil density and compressibility at each pressure step
- Gas compressibility factor (Z) of the evolved gas at each step
3. Constant Volume Depletion (CVD) — for Gas Condensate
Similar to DL but designed for gas condensate or volatile oil systems. The cell volume is maintained constant at each step (gas is removed to restore the original cell volume), simulating the behavior of a volumetric depletion reservoir where liquid condensate drops out at reservoir conditions.
What it tells you:
- Liquid dropout (retrograde condensation): The volume percent of liquid forming at reservoir conditions as pressure drops below the dew point
- Two-phase Z-factor: For material balance calculations and production forecasting
- Produced gas composition at each depletion stage
- Condensate-to-gas ratio (CGR) evolution during depletion
4. Separator Tests
The reservoir fluid is flashed through a series of separator conditions representative of the planned production facility (e.g., high-pressure separator → low-pressure separator → stock tank). This test quantifies the surface GOR and stock-tank liquid volume that will actually be produced under field operating conditions, which differs from the DL test values because of the multi-stage flash conditions.
Separator test results are used to convert DL data from reservoir conditions to surface conditions — a critical step for reservoir simulation input and production reporting.
5. Viscosity Measurements
Oil and gas viscosity at reservoir conditions is measured at each pressure step (often as part of the DL or CCE test). Viscosity is a key input to reservoir simulation (flow resistance), wellbore flow modeling, and surface facility design (pump sizing, flow assurance).
6. Fluid Composition Analysis
Detailed compositional analysis of the reservoir fluid by gas chromatography (GC) provides the mole fractions of each component from C1 to C10+, plus non-hydrocarbon components (N2, CO2, H2S). This is the starting point for EOS characterization and tuning.
From Raw Data to Reservoir Model: The EOS Workflow
The PVT laboratory data described above represents measured physical reality. To use it in a reservoir simulator (Eclipse, CMG, Petrel RE), the data must be translated into an equation of state (EOS) fluid model — a mathematical description that can predict fluid properties at any pressure and temperature condition, not just the specific points measured in the lab.
The EOS characterization and tuning workflow involves:
- Initial EOS setup: Using the measured fluid composition with a cubic EOS (Peng-Robinson or SRK), predict all PVT properties.
- Quality check: Compare the EOS predictions against measured lab data (bubble point, Bo, Rs, viscosity). Identify where the predictions deviate from measurements.
- EOS tuning: Adjust EOS parameters (BIPs, component critical properties, Ω values for heavy components) to minimize the difference between predictions and measurements.
- Validation: Verify that the tuned EOS reproduces not just the calibration data but also independent test data (e.g., a different separator test condition).
- Lumping and export: For simulator use, reduce the number of EOS components through pseudocomponent lumping, then export the tuned EOS in the simulator’s input format.
This workflow is exactly what PVTz is designed to support — from importing raw laboratory data through quality control, material balance checks, EOS fitting, and standardized report generation for the reservoir engineering team.
Common PVT Data Quality Issues
PVT data quality is a persistent challenge. Common issues include:
- Non-representative sample: The fluid sample was taken at conditions where some condensation or vaporization had already occurred. The resulting “reservoir fluid” has a different composition than the actual in-situ fluid.
- Inconsistent CCE and DL bubble points: The bubble point determined from the CCE test should match the first gas appearance step in the DL test. A significant discrepancy indicates a sample quality or experimental issue.
- Material balance closure failures: The mass of fluid injected into the PVT cell at the start should equal the mass of all products removed plus the residual at the end of the DL or CVD test. Closure errors >2% indicate measurement problems.
- Recombination errors: For samples recombined from separator oil and gas, the recombination GOR must be accurately known. Errors in the recombination ratio propagate to all downstream PVT calculations.
Why PVT Data Quality Matters So Much
Every hydrocarbon resource estimate, recovery factor calculation, and facility design decision is built on PVT data. Errors in the PVT characterization propagate systematically through the reservoir model and can lead to:
- Incorrect OOIP/OGIP estimates (multi-billion dollar decisions based on PVT-derived formation volume factors)
- Suboptimal separator pressures (leaving valuable liquids in the gas stream or creating two-phase flow problems)
- Incorrect production forecast curves (affecting project economics and investment decisions)
- EOS models that don’t match fluid behavior during gas injection or CO₂ flooding
Rigorous PVT quality control — using automated tools to check material balance closure, detect outliers, and validate consistency between experiments — is therefore not an academic exercise but a direct driver of field development value.
Conclusion
PVT analysis provides the thermodynamic foundation for reservoir engineering. Understanding the four core experiments — CCE, DL/CVD, separator tests, and compositional analysis — and how they feed into EOS characterization and reservoir simulation gives engineers the context to critically evaluate PVT data quality and make better decisions throughout the field development lifecycle.
For PVT laboratory teams managing the data processing workflow from raw instrument output to validated EOS models, PVTz provides an end-to-end solution — from GC file import and material balance QC through EOS fitting and standardized report generation.